Over the past week, the price of Cardano (ADA) has increased by nearly 21%, and in the last 24 hours alone, it has risen by about 7%, making it one of the major coins with the most positive developments. This upward momentum was initially considered quite sustainable, as technical signals on the chart indicated an improving trend.
However, upon deeper analysis, the market picture becomes more complex. Although the overall trend still leans towards growth, momentum indicators suggest that the strength of the trend is gradually weakening. Instead of a sharp correction, current data indicate a high likelihood that ADA will enter a sideways accumulation phase before establishing its next direction. Below are detailed analyses of the market signals.
Uptrend maintained, but momentum decreasing on the 12-hour chart
On the 12-hour timeframe, ADA still maintains an uptrend structure. A notable positive signal is the upcoming crossover between the exponential moving averages (EMA), as the 20-period EMA approaches the 50-period EMA. This crossover often signals that the medium-term trend is being reinforced.
However, momentum indicators show signs of stagnation. From December 9 to January 6, ADA’s price was trending downward while the (RSI) increased. This is a hidden bearish divergence—often indicating weakening momentum, with potential short-term correction risks, rather than a trend reversal.
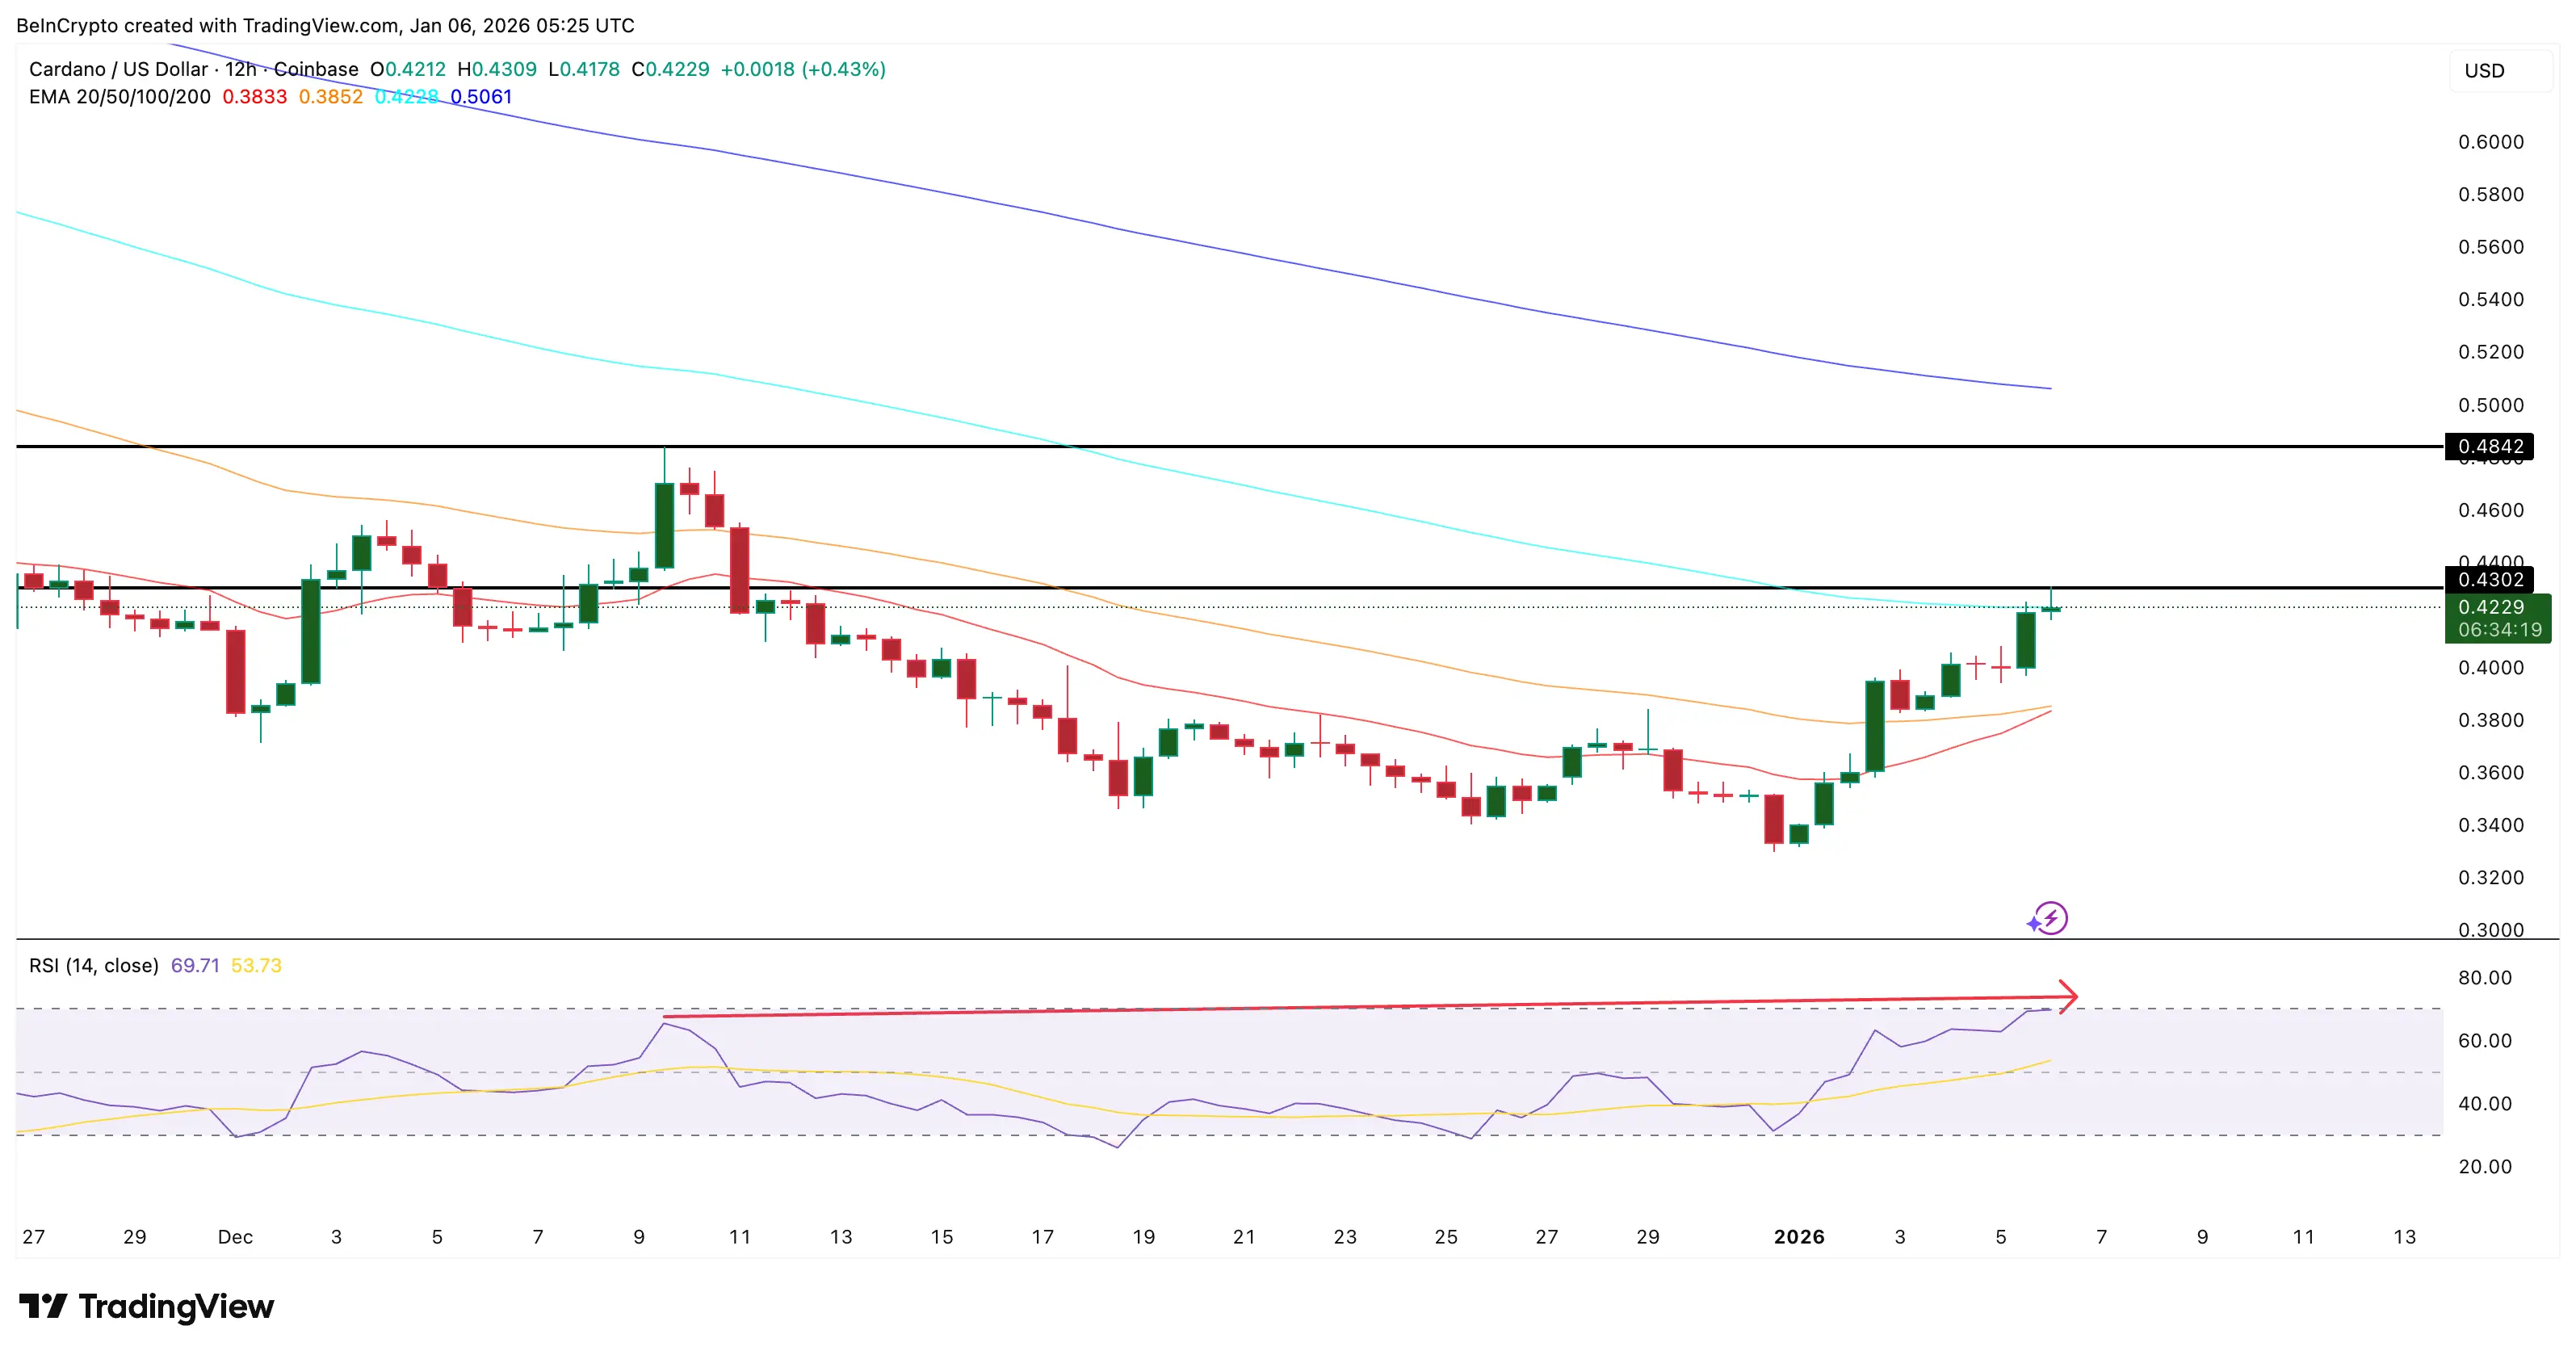 Conflicting indicators appear | Source: TradingView If the next candle of ADA forms below the $0.43 level, a lower high pattern will be confirmed, increasing the risk of correction.
In summary, the uptrend still exists, but the driving force has weakened. This combination often leads to an accumulation phase, moving sideways rather than continuing a strong rise or a sharp decline.
On-chain data: Patient investors, no signs of panic
On-chain indicators suggest the likelihood of a deep correction is quite low at this time.
The Spent Coins Age Bands index tracks the amount of ADA moved by investor groups with different holding periods. When this value decreases, it indicates that investors are holding onto their coins rather than selling.
The two most prominent groups are:
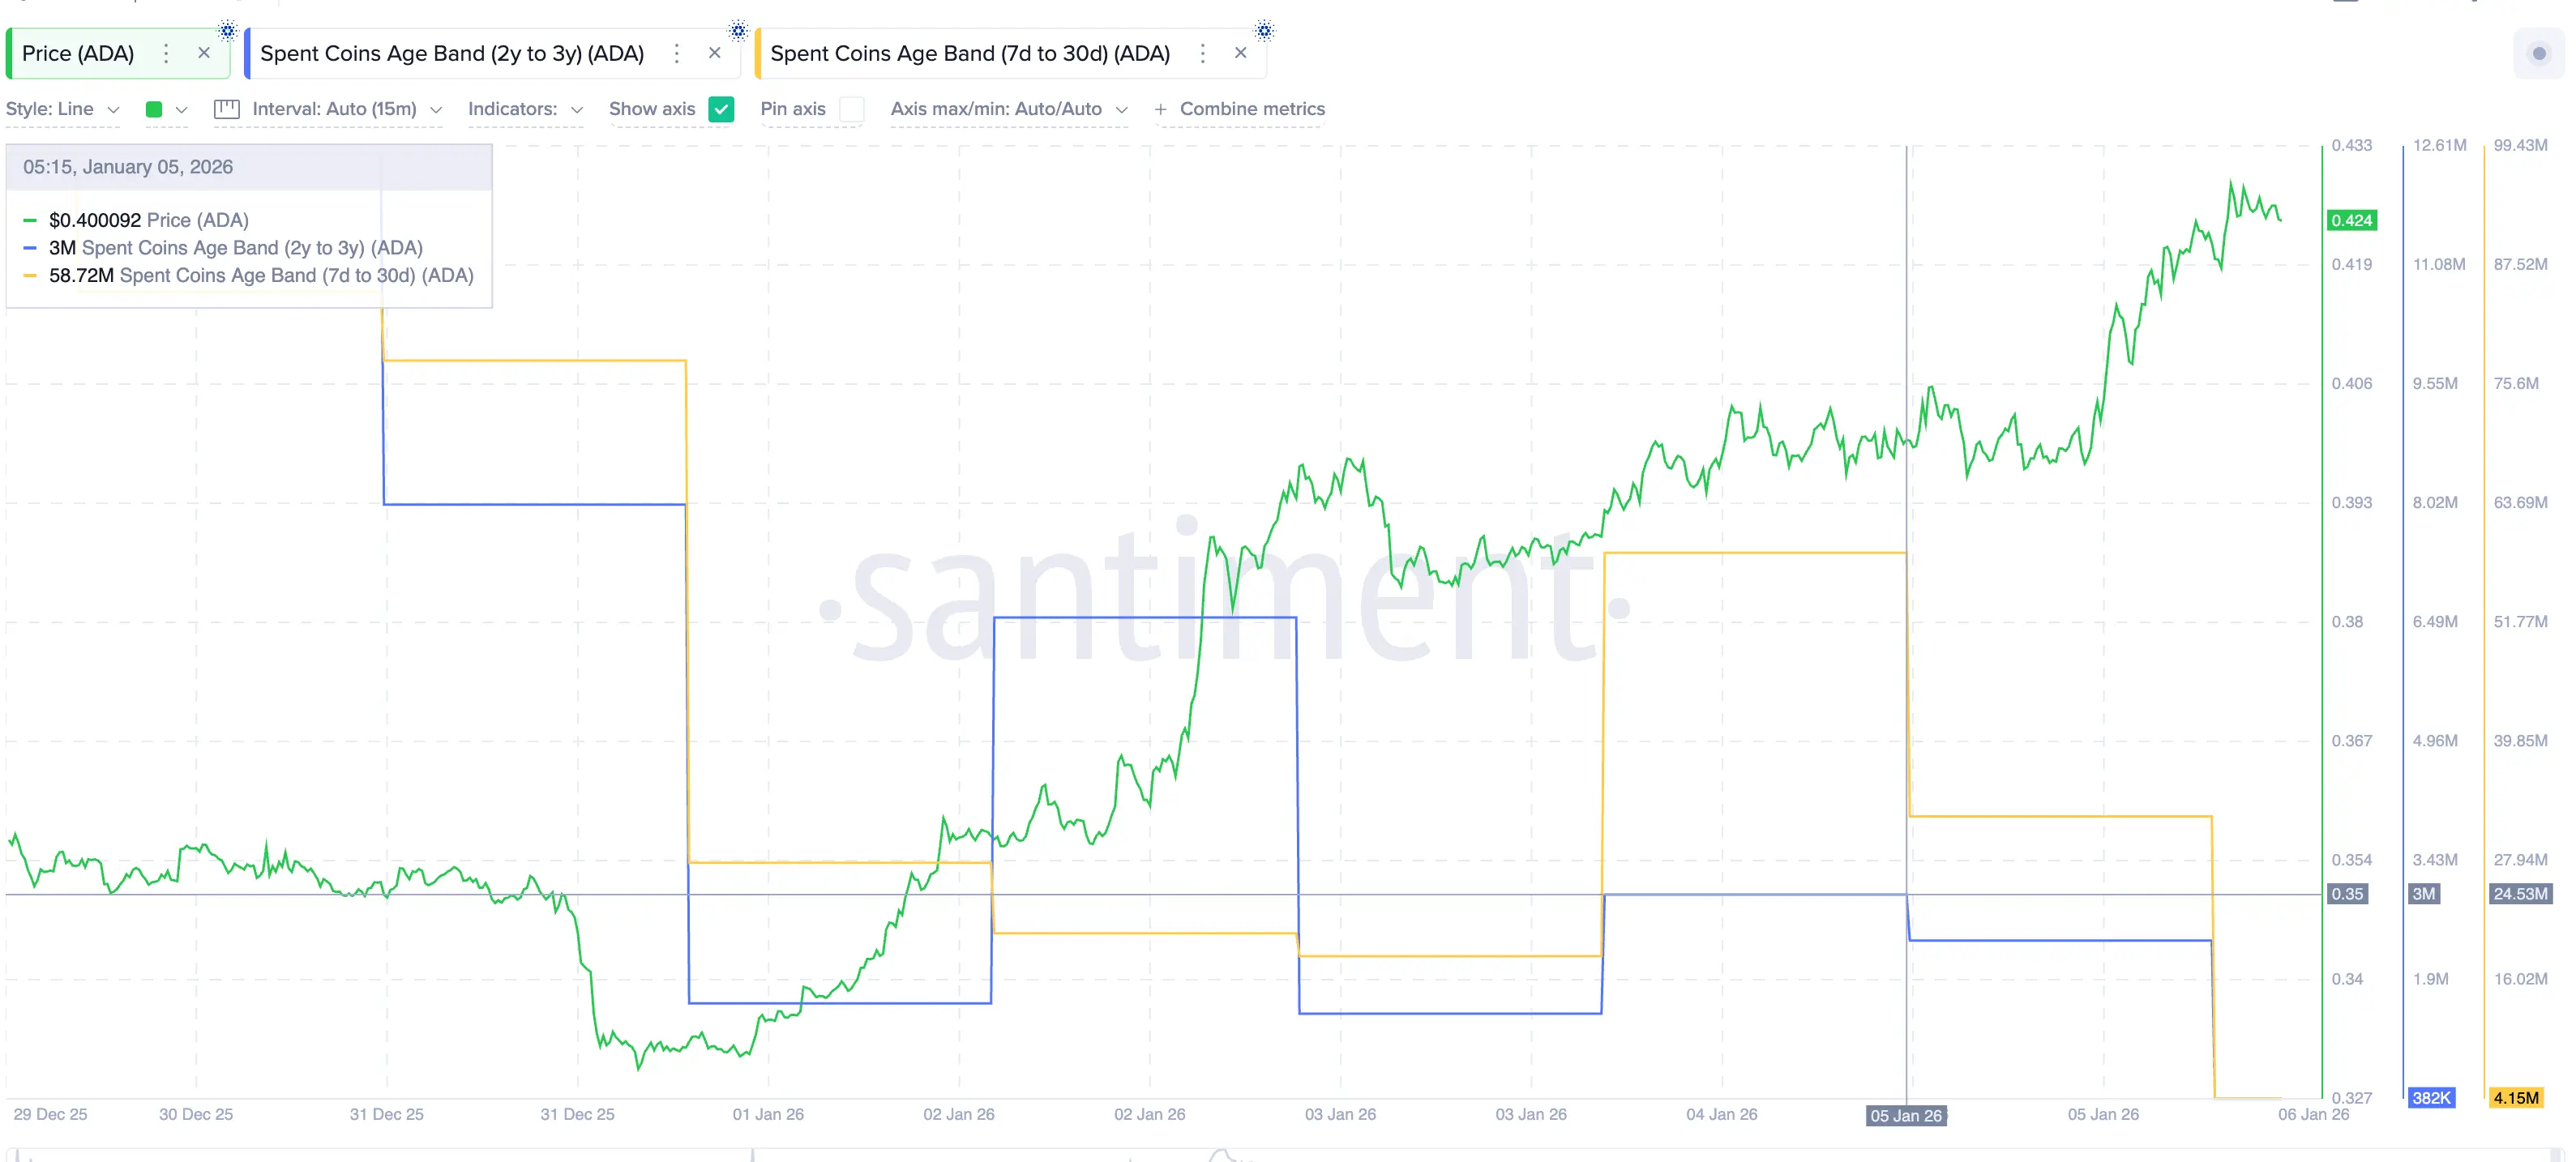 Slow transaction activity of ADA coins | Source: Santiment This shows that both short-term and long-term investors are choosing patience, with no signs of panic selling or strong profit-taking, even after the recent impressive rally.
When market momentum decreases but capital flow remains low, the market typically shifts into an accumulation state, trading within a narrow range rather than experiencing sharp declines.
Important ADA price levels: Trading range of 9%
In the context of weakening trend strength and momentum, price levels become particularly significant.
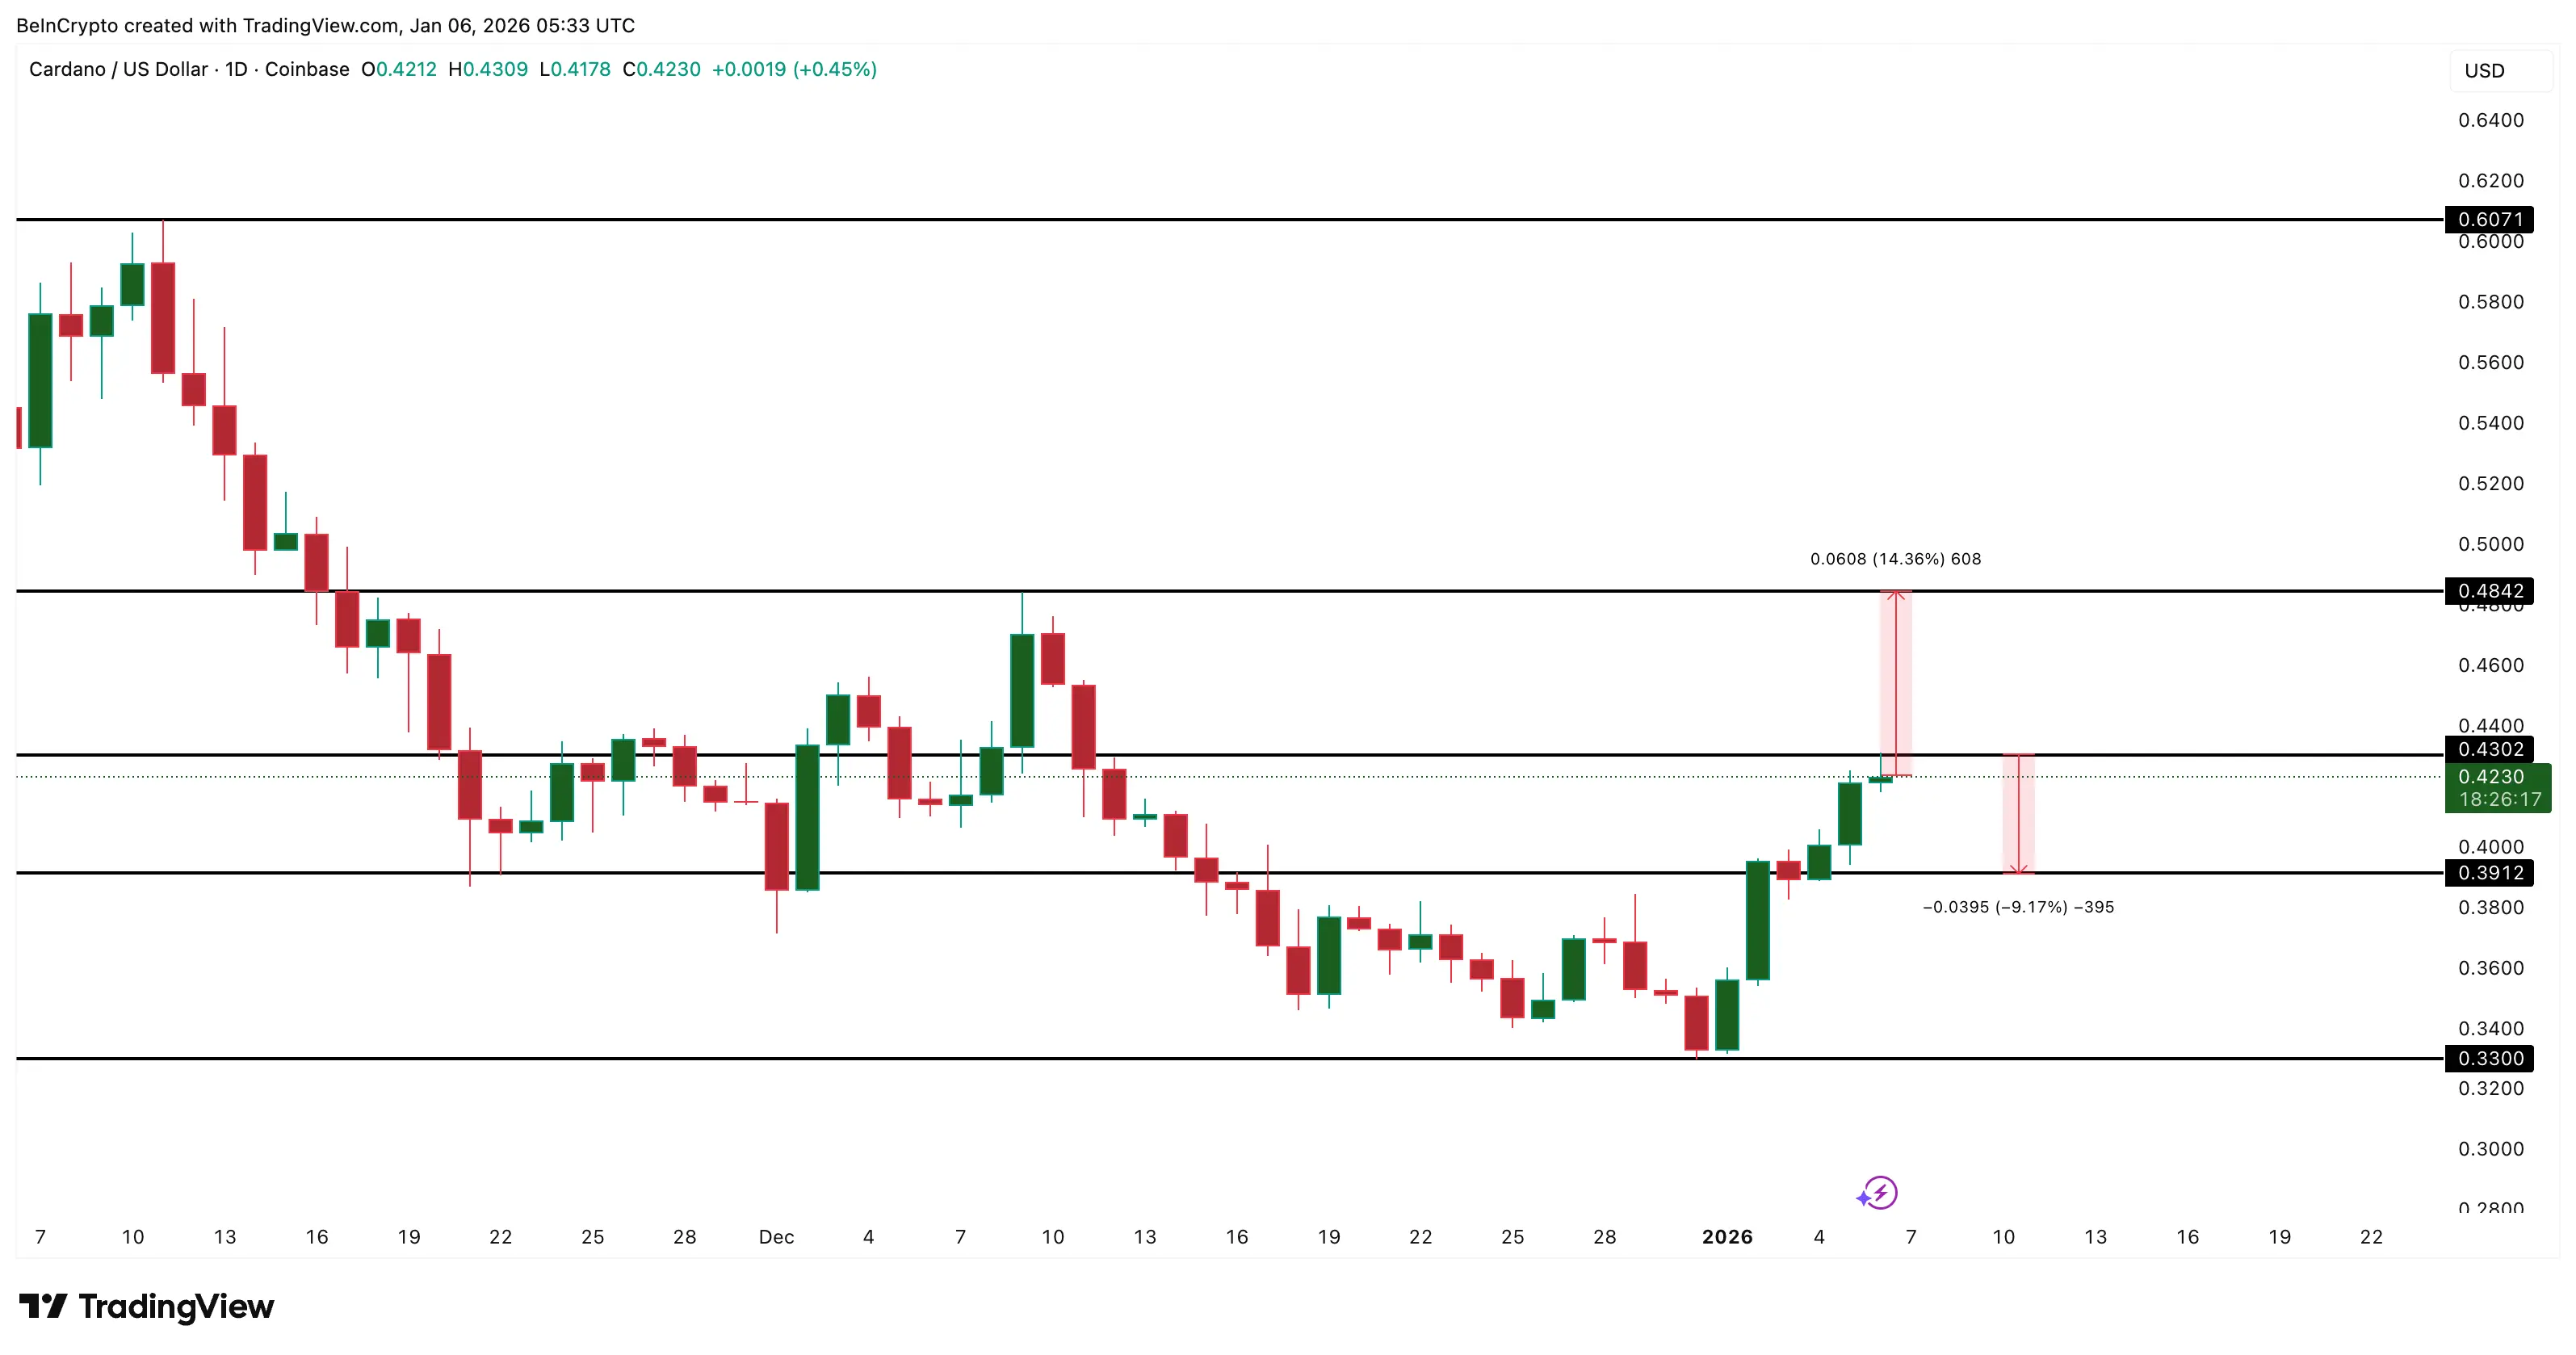 ADA price analysis | Source: TradingView Until one of these levels is broken, the most likely scenario is that ADA will trade within the range of $0.39 to $0.43, corresponding to about a 9% fluctuation.
This range accurately reflects the current market dynamics: the uptrend still exists, patient investors have not sold, but momentum needs time to reset before the next major move.
Disclaimer: The information on this page may come from third parties and does not represent the views or opinions of Gate. The content displayed on this page is for reference only and does not constitute any financial, investment, or legal advice. Gate does not guarantee the accuracy or completeness of the information and shall not be liable for any losses arising from the use of this information. Virtual asset investments carry high risks and are subject to significant price volatility. You may lose all of your invested principal. Please fully understand the relevant risks and make prudent decisions based on your own financial situation and risk tolerance. For details, please refer to
Disclaimer.
Related Articles
REQ Soars 21.77% — What Does This Mean for Traders?
Request Network (REQ) surged 21.77% within an hour, reaching $0.0839 amid growing trader interest. Market conditions, bullish sentiment, and DeFi trends may be driving this rally, while traders monitor key resistance and support levels for future movements.
Coinfomania29m ago
Goldman Sachs Becomes Largest Holder of XRP ETFs With $153.8 Million in Holdings
Goldman Sachs becomes largest holder of XRP ETFs.
The entity now holds a total of $153.8 million in holdings.
This shows a promising future for the price of XRP.
The crypto community is thrilled to see the slight rise in crypto prices today. Presently, the price of Bitcoin (BTC), the p
CryptoNewsLand30m ago
BTC 15-minute decline of 0.61%: Major wallet selling pressure combined with negative US employment data triggers adjustment
Between 2026-03-12 14:15 and 14:30 (UTC), BTC price declined from 70660.0 USDT to 69917.2 USDT, with a 15-minute return rate of -0.61% and volatility reaching 1.06%. Trading volume increased sequentially, with market attention rising notably, and heightened fluctuations triggering alerts among short-term traders.
The primary driver of this price movement was on-chain whale wallets concentrating approximately 2,100 BTC inflows to exchanges within a short timeframe, representing an 18% increase compared to the previous period. Large holders' active position adjustments and concurrent large sell orders in spot and perpetual markets were simultaneously released.
GateNews49m ago
Stablecoin neo EURO captures only 0.35% of market supply
Stablecoins pegged to the EURO only represent 0.35% of total supply and less than 0.1% of total global trading volume, demonstrating limited market liquidity significance compared to USD stablecoins. Notable EURO stablecoins include EURC, EURCV, AEUR, EURI, and EURe.
TapChiBitcoin55m ago
ETH 15-minute rise of 0.72%: On-chain capital inflows and bullish sentiment dominating the market
2026-03-12 14:00 to 2026-03-12 14:15 (UTC), ETH spot price showed rapid upward movement with a 15-minute return rate of +0.72%, price range between 2065.45 to 2082.77 USDT, and overall volatility of 0.84%. During this market fluctuation, market attention increased, trading volume rose sequentially, and unilateral buy-side orders drove market sentiment to remain bullish.
The main driver of this price movement was large-scale on-chain capital inflows and the linkage effect between spot and futures markets. On-chain data shows multiple high-net-worth wallets
GateNews1h ago
Altcoin About to 10x? History Is Literally Repeating Itself
Crypto analysts suggest the altcoin market may be entering another expansion phase, similar to patterns seen in past rallies. While investor interest grows, indicators show the altcoin cycle hasn't begun yet, with high Bitcoin dominance and a low Altcoin Season Index.
Coinfomania1h ago