
Date: Fri, Jan 02, 2026 | 10:54 AM GMT
The broader cryptocurrency market has started the new year with modest strength, as both Bitcoin (BTC) and Ethereum (ETH) trade slightly higher with gains of over 2%. This renewed stability across majors has helped improve overall sentiment, allowing several altcoins to regain momentum — including Aster (ASTER).
ASTER is currently trading around 4% higher on the day, but the more important development lies beneath the surface. On lower timeframes, price action is beginning to highlight a constructive bullish structure, suggesting that the token may be preparing for a meaningful breakout if the setup confirms.
Source: Coinmarketcap
Ascending Triangle Structure Takes Shape
On the 4-hour chart, ASTER is forming a clear ascending triangle, defined by a series of higher lows pressing steadily against a horizontal resistance zone. This type of structure is widely regarded as a bullish continuation pattern, particularly when it develops during consolidation and shows consistent buyer accumulation at rising support levels.
ASTER recently faced rejection near the $0.7367 neckline resistance, which pushed price back toward its ascending support trendline around the $0.68 region. Importantly, each dip has been met with strong buying interest, preventing any deeper pullback and keeping the bullish structure intact. This behavior indicates that sellers are gradually losing control as buyers step in earlier on every retracement.
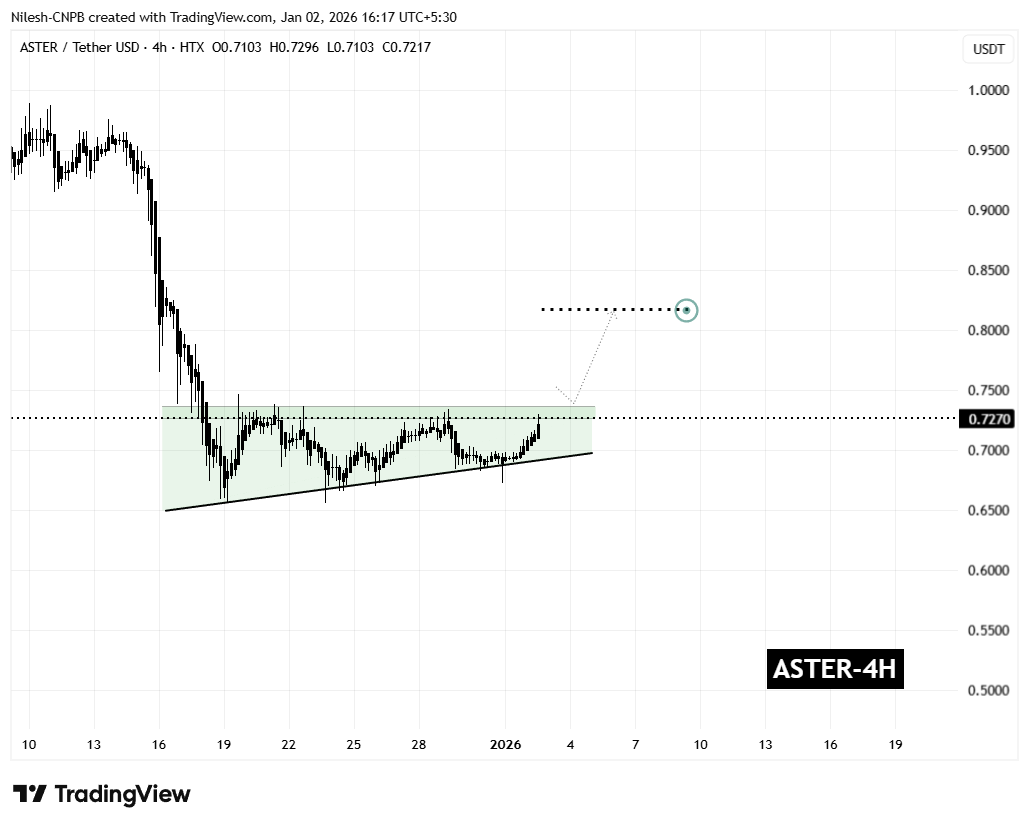
Aster (ASTER) 4H Chart/Coinsprobe (Source: Tradingview)
The latest rebound has once again carried ASTER toward the upper boundary of the triangle, reinforcing the idea that demand remains firm. Rather than signaling weakness, this sideways-to-higher price action reflects healthy consolidation as volatility tightens ahead of a potential breakout.
What’s Next for ASTER?
From here, ASTER appears to be preparing for another test of the $0.7367 resistance zone. A decisive breakout above this level, followed by a sustained close and a successful retest as support, would confirm the ascending triangle pattern and likely trigger a bullish expansion phase.
Based on the measured move of the formation, the technical upside projection points toward the $0.8178 region. This target represents a potential upside of roughly 12% from current levels and also aligns with previous price structure, adding further confidence to the bullish outlook.
That said, caution remains warranted. If ASTER fails to break above resistance, price could once again drift back toward the rising support trendline. As long as this trendline continues to hold, the broader bullish setup remains valid. A decisive breakdown below support, however, would invalidate the pattern and postpone any breakout scenario.
For now, the combination of improving market sentiment, consistent dip-buying, and a tightening ascending triangle structure suggests that Aster is approaching a critical decision point — one that could define its next significant move as 2026 begins.
Disclaimer: The views and analysis presented in this article are for informational purposes only and reflect the author’s perspective, not financial advice. Technical patterns and indicators discussed are subject to market volatility and may or may not yield the anticipated results. Investors are advised to exercise caution, conduct independent research, and make decisions aligned with their individual risk tolerance.
About Author: Nilesh Hembade is the Founder and Lead Author of Coinsprobe, with over 5 years of experience in the cryptocurrency and blockchain industry. Since launching Coinsprobe in 2023, he has been providing daily, research-driven insights through in-depth market analysis, on-chain data, and technical research.
Disclaimer: The information on this page may come from third parties and does not represent the views or opinions of Gate. The content displayed on this page is for reference only and does not constitute any financial, investment, or legal advice. Gate does not guarantee the accuracy or completeness of the information and shall not be liable for any losses arising from the use of this information. Virtual asset investments carry high risks and are subject to significant price volatility. You may lose all of your invested principal. Please fully understand the relevant risks and make prudent decisions based on your own financial situation and risk tolerance. For details, please refer to
Disclaimer.
Related Articles
Bitcoin finds stability at 2023 investor cost basis, echoing past cycle
Bitcoin support has recently aligned with the 2023 average realized price of approximately $63,700. This level has held during price fluctuations and mirrors past cycles. Current data shows newer cohorts are facing underwater positions, while the aggregate realized price indicates potential support at $54,000 if prices decline further.
CoinDesk13m ago
Bitcoin Reclaims $68.4K, Tests Critical $71.4K Resistance
_Bitcoin reclaimed $68.4K support, filled the CME gap at $70.1K, and now tests $71.4K resistance. Bears stay in control below that level._
Bitcoin bounced off the 68.4K level and climbed toward 71.4K. The move came after the CME futures gap at 70.1K got filled. Structure, though, still reads
LiveBTCNews25m ago
Gate Index BVIX Hits "Panic Subsiding" Signal, US Stock Panic Index VIX Falls in Sync
On March 24, Gate News reported that the BVIX index declined 6.05% to 53.25, with sentiment showing "panic receding," while EVIX fell 4.68% to 76.12, with sentiment "easing." Meanwhile, the VIX index dropped to 25.02, with 24-hour trading volume surging 152.96%.
GateNews45m ago
Analysts Grow More Confident Over Bitcoin’s Final Rally in 2026, Bullish Then Bearish
Analysts grow more confident over Bitcoin’s final rally in 2026.
A bullish rally is expected first before a major fall in prices.
The price of Bitcoin is expected to fall as far as the $30,000 price range.
The crypto community is once again pleased to see the price of BTC trading over t
CryptoNewsLand1h ago
Bitcoin Faces Two Price Scenarios as Strait of Hormuz Tensions Dominate Oil Market
Recent market analysis from Wintermute indicates that geopolitical tensions in the Strait of Hormuz could significantly impact Bitcoin prices in the short term. If transportation normalizes and oil stabilizes around $100 per barrel, Bitcoin might test resistance levels between $74,000 and $76,000. Conversely, if shipping restrictions persist or conflicts escalate, Bitcoin could drop to around $60,000 due to increased macroeconomic pressure and cautious investor sentiment.
TapChiBitcoin1h ago
XRP Price Warning: Drop to $0.87 Before Ripping Higher – Here’s the Analyst’s Plan
Analyst TARA's Elliott Wave analysis suggests that XRP may drop to $0.87 before a significant rally, indicating the current gains could be a fakeout. Traders should watch for a potential bounce to $1.51, but be prepared for further declines to $1.12 or $0.87 as strategic accumulation zones.
CaptainAltcoin1h ago
