
**Date: **Tue, Jan 06, 2026 | 10:08 AM GMT
The broader cryptocurrency market continues to show fresh strength at the start of the new year. Both Bitcoin (BTC) and Ethereum (ETH) are posting weekly gains of over 6%, helping restore confidence across the market. This improving sentiment is now spilling over into major altcoins — including Jupiter (JUP).
JUP has already delivered an impressive 20% gain on the week. While the short-term momentum is encouraging, the more important development is unfolding on the higher-timeframe chart. Recent price action suggests a meaningful shift in market behavior, hinting that JUP could be transitioning from a corrective phase into a broader bullish continuation if key resistance zones are reclaimed.
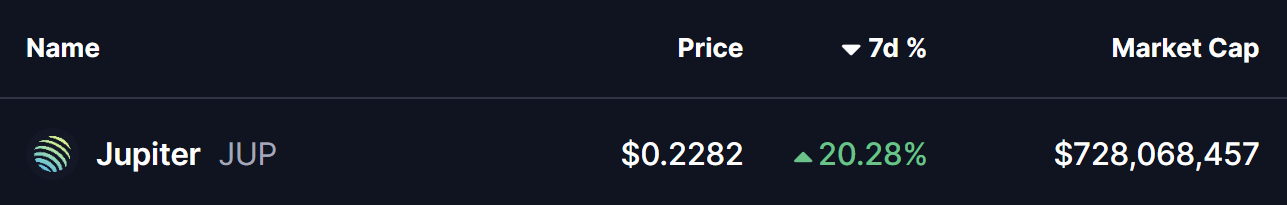
Source: Coinmarketcap
Rounding Bottom Formation Taking Shape
On the daily chart, Jupiter appears to be forming a rounding bottom pattern — a classic bullish reversal structure that typically develops after extended downside pressure and gradual seller exhaustion.
This setup began after JUP faced a strong rejection from the $0.4540–$0.4760 resistance zone in late October. That rejection triggered a sharp sell-off, dragging price lower toward the $0.17 region. However, bears failed to maintain control beyond that point. Selling pressure faded, demand began to absorb supply, and price started stabilizing.
Over time, volatility compressed and JUP began curling higher in a smooth, rounded fashion — closely matching the textbook behavior of a developing rounding bottom. Importantly, the recent recovery has pushed price back above the 50-day moving average around $0.2192, a level that previously capped upside attempts and now appears to be turning into support.
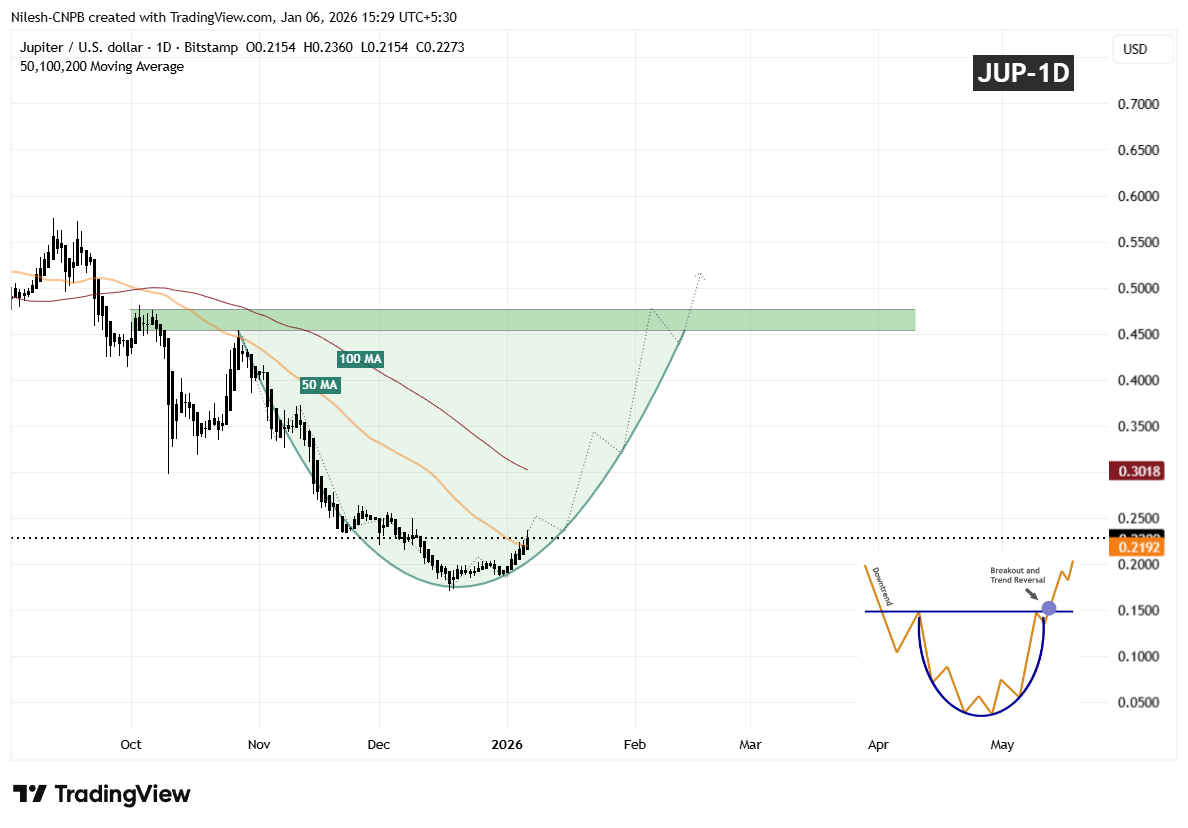
Jupiter (JUP) Daily Chart/Coinsprobe (Source: Tradingview)
The gradual slope of the recovery suggests organic accumulation rather than speculative spikes, reinforcing the credibility of the developing base.
What’s Next for JUP?
If JUP continues to hold above the 50-day moving average, this level could serve as a solid foundation for further upside, with the 100-day moving average acting as the next upside magnet in the near term.
A clean and decisive breakout above the $0.4540–$0.4760 resistance zone, followed by sustained acceptance above that area, would confirm the rounding bottom reversal and likely open the door for a broader bullish expansion phase.
Until that breakout occurs, the pattern remains in development. Some short-term consolidation or shallow pullbacks are possible as price digests recent gains. However, as long as JUP continues to print higher lows above the established base, the broader structure remains constructive.
For now, the chart suggests Jupiter is approaching a critical confirmation phase — one that could determine whether this recovery matures into a sustained bullish trend as 2026 progresses.
Disclaimer: The views and analysis presented in this article are for informational purposes only and reflect the author’s perspective, not financial advice. Technical patterns and indicators discussed are subject to market volatility and may or may not yield the anticipated results. Investors are advised to exercise caution, conduct independent research, and make decisions aligned with their individual risk tolerance.
About Author: Nilesh Hembade is the Founder and Lead Author of Coinsprobe, with over 5 years of experience in the cryptocurrency and blockchain industry. Since launching Coinsprobe in 2023, he has been providing daily, research-driven insights through in-depth market analysis, on-chain data, and technical research.
Disclaimer: The information on this page may come from third parties and does not represent the views or opinions of Gate. The content displayed on this page is for reference only and does not constitute any financial, investment, or legal advice. Gate does not guarantee the accuracy or completeness of the information and shall not be liable for any losses arising from the use of this information. Virtual asset investments carry high risks and are subject to significant price volatility. You may lose all of your invested principal. Please fully understand the relevant risks and make prudent decisions based on your own financial situation and risk tolerance. For details, please refer to
Disclaimer.
Related Articles
Fidelity Investments: Bitcoin testing long-term support—are bullish divergences signaling a potential base being formed?
Fidelity Investments’ chief macroeconomic officer, Jurrien Timmer, analyzes Bitcoin’s price action and believes it is finding support in the $65k to $70k range, showing strong technical signals. Bitcoin is currently at relatively low levels versus the power-law support line and the Golden Ratio Z-score, which could be setting up a bullish divergence. If it can hold steady, the market may correct and rebound, but investors need to watch out for inflation and liquidity risks.
ChainNewsAbmedia32m ago
XRP Faces Selling Pressure While Key Support Near $1.28 Holds
Key Insights:
XRP continues forming lower highs and lows, while price remains below major moving averages, reinforcing a sustained bearish structure across timeframes.
Open interest spikes during volatility signaled speculative trading, yet declining levels now reflect reduced risk
CryptoNewsLand7h ago
Cardano Price Near $0.245 Level as Market Momentum Weakens
Cardano's price is stabilizing around the $0.245 support level amid market consolidation and declining momentum. The inability to break resistance at $0.268 raises concerns about upward strength. Meanwhile, development of the new node version 10.7.0 is in testing, promising enhancements for the ecosystem.
CryptoNewsLand7h ago
Dogecoin Holds Near $0.09 as April Pattern Shapes Outlook
Key Insights
Dogecoin maintains stability above the $0.09 support, with buyers defending the level despite consistent selling pressure that limits strong upward momentum in early April trading sessions.
April performance remains historically mixed, with past rallies and declines shaping
CryptoNewsLand7h ago
Here’s why bitcoin’s drop below $68,000 raises the risk of a crash under $60,000
President Donald Trump's renewed aggressive posturing toward Iran has pushed bitcoin lower by roughly 2% over the past 24 hours to $67,000. While this price action is consistent with routine volatility, beneath the surface, market structure looks fragile.
This is mainly due to flows in the
CoinDesk8h ago
PEPE Signals Range-Bound Move as Momentum Weakens
PEPE's trading remains cautious with neutral RSI and weak MACD, indicating limited momentum and ongoing selling pressure. Oversold stochastic hints at possible short-term rebounds, but traders await confirmation before entering positions amid mixed signals.
CryptoNewsLand8h ago
