
Date: 11 Jan 2026, 06:20 PM GMT
Key Highlights
-
Pump.fun (PUMP) posts over 6% intraday gains as broader crypto market sentiment improves.
-
The 4H chart shows a bearish ABCD harmonic pattern, with the bullish CD leg currently in play.
-
Price rebounded strongly from the 100-period moving average, reinforcing trend strength.
-
The pattern projects a potential upside move toward the $0.00296 region.
-
Holding above the $0.00225 support zone remains critical to sustain the bullish structure
The broader cryptocurrency market has regained modest upward momentum today, with both Bitcoin (BTC) and Ethereum (ETH) returning to positive territory. This improvement in sentiment has helped stabilize the altcoin space, and Pump.fun (PUMP) is emerging as one of the stronger performers, posting over a 6% intraday gain.
Beyond the short-term price bounce, PUMP’s chart structure is beginning to show a technically constructive setup that suggests additional upside could be developing.
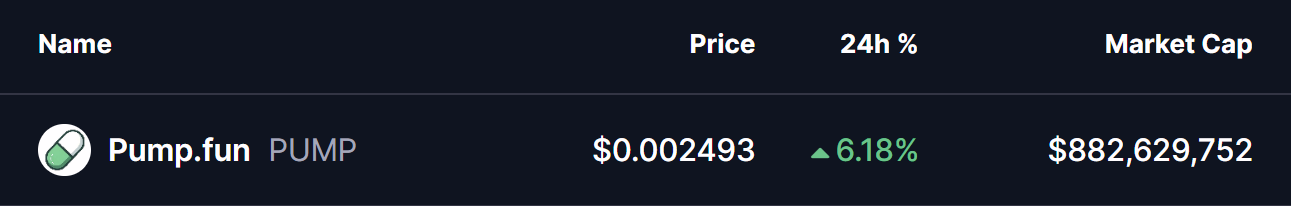
Source: Coinmarketcap
Harmonic Pattern Signals Bullish Continuation
On the 4-hour timeframe, PUMP appears to be forming a bearish ABCD harmonic pattern — a structure that often develops during the later stages of an uptrend. While this pattern can eventually signal a reversal once the final leg completes, the CD leg itself is typically driven by strong bullish momentum, often producing notable upside before any exhaustion sets in.
As illustrated on the chart, the pattern initiated at Point A near $0.00179, followed by a sharp impulsive rally into Point B around $0.00272. Price then entered a corrective phase, pulling back toward Point C near $0.00203.
Importantly, this retracement aligned closely with the 100-period moving average, where buyers stepped in decisively. The swift reaction from this zone reinforced the strength of the underlying trend and helped preserve the harmonic structure.
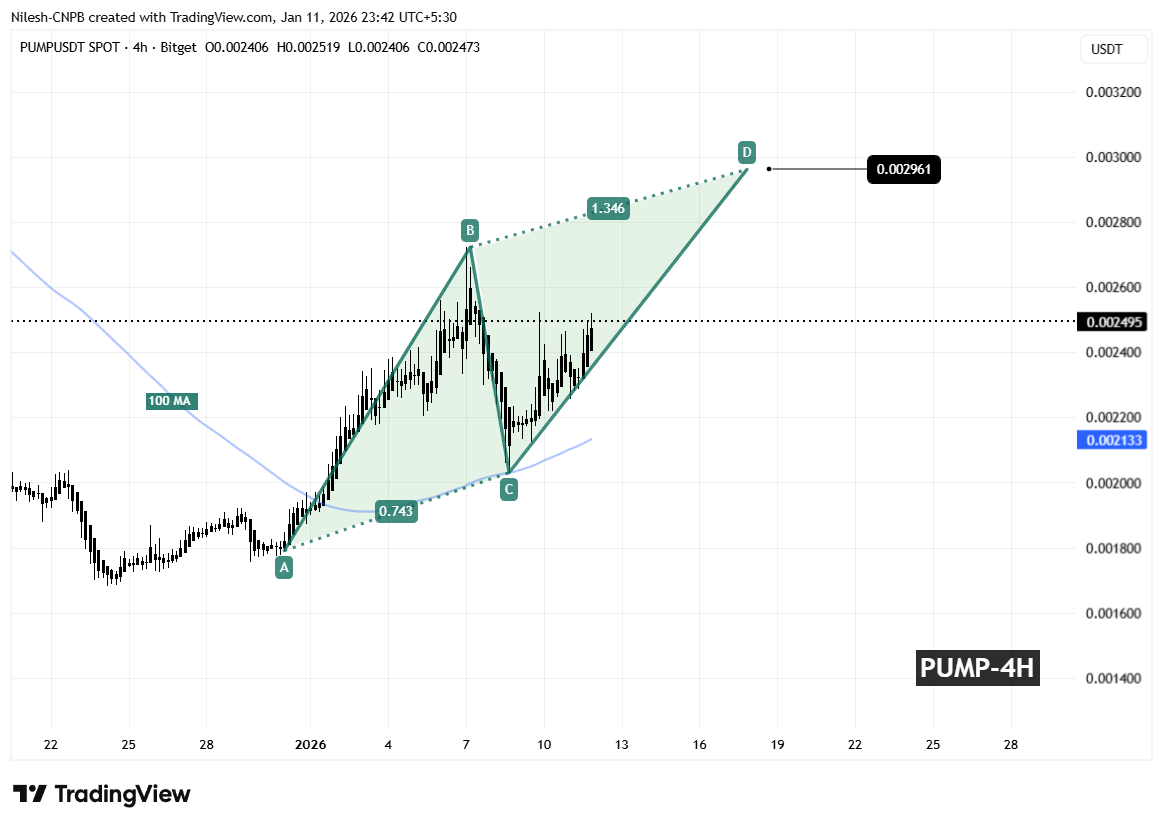
Pump.fun (PUMP) 4H Chart/Coinsprobe (Source: Tradingview)
Since bouncing from Point C, PUMP has resumed its advance and is now trading back around the $0.0025 area, signaling that the CD leg is actively unfolding.
What Could Come Next for PUMP?
If the ABCD pattern continues to play out as projected, the CD leg could extend toward the 1.346 Fibonacci projection of the BC segment. This places the Potential Reversal Zone (PRZ) near $0.00296, which sits roughly 18% above current price levels.
This zone is typically where traders begin to watch for signs of short-term exhaustion or profit-taking, as harmonic patterns often complete around these extensions. Until then, momentum favors the bulls, provided the structure remains intact.
From a risk perspective, holding above the $0.00225 support region will be crucial. A decisive breakdown below this level would weaken the harmonic setup and increase the likelihood of renewed downside pressure.
For now, PUMP’s price action remains technically constructive, with buyers defending key levels and momentum pointing toward a possible continuation higher before any broader consolidation or reversal attempt emerges.
Frequently Asked Questions (FAQ)
What is driving Pump.fun (PUMP) price higher today?
PUMP is benefiting from improving overall market sentiment and a bullish harmonic structure on the 4-hour chart, supported by strong buying interest near the 100-period moving average.
What pattern is forming on the PUMP chart?
The chart indicates a bearish ABCD harmonic pattern. While such patterns can lead to reversals at completion, the CD leg often produces strong bullish momentum before that point.
What is the upside target for Pump.fun (PUMP)?
If the CD leg continues, the projected upside target lies near the $0.00296 level, which aligns with the 1.346 Fibonacci extension.
Is Pump.fun (PUMP) still bullish in the short term?
As long as price remains above key support and momentum holds, the short-term outlook remains cautiously bullish.
Disclaimer: The views and analysis presented in this article are for informational purposes only and reflect the author’s perspective, not financial advice. Technical patterns and indicators discussed are subject to market volatility and may or may not yield the anticipated results. Investors are advised to exercise caution, conduct independent research, and make decisions aligned with their individual risk tolerance.
About Author: Nilesh Hembade is the Founder and Lead Author of Coinsprobe, with over 5 years of experience in the cryptocurrency and blockchain industry. Since launching Coinsprobe in 2023, he has been providing daily, research-driven insights through in-depth market analysis, on-chain data, and technical research.
Disclaimer: The information on this page may come from third parties and does not represent the views or opinions of Gate. The content displayed on this page is for reference only and does not constitute any financial, investment, or legal advice. Gate does not guarantee the accuracy or completeness of the information and shall not be liable for any losses arising from the use of this information. Virtual asset investments carry high risks and are subject to significant price volatility. You may lose all of your invested principal. Please fully understand the relevant risks and make prudent decisions based on your own financial situation and risk tolerance. For details, please refer to
Disclaimer.
Related Articles
BTC Drops 0.57% in 15 Minutes: ETF Capital Deceleration and Derivatives Short Positioning Create Synchronized Selling Pressure
2026-03-25 12:15 to 12:30 (UTC), BTC recorded a -0.57% return within 15 minutes, with price range between 71126.1 to 71751.0 USDT, and amplitude of 0.87%. Market attention increased during this period, with notably intensified volatility, indicating elevated short-term capital participation and shrinking risk appetite.
The primary driver of this movement is the marginal slowdown in ETF capital inflows, weakened buying power in the spot market, and some holders choosing to reduce positions at higher levels. Combined with the derivatives market dominated by short positioning structure, negative funding rates persisting, and longs
GateNews6m ago
ETH drops 0.86% in 15 minutes: On-chain whale transfers and contract long liquidations amplify selling pressure
2026-03-25 12:15 to 12:30 (UTC), ETH experienced a sharp yield decline of -0.86% in an extremely short timeframe, with a price range between 2167.58 to 2191.55 USDT, reaching an amplitude of 1.09%. During this period, market attention surged rapidly, with trading activity and volatility intensifying in sync, resulting in significant short-term price movements that attracted substantial investor focus.
The primary driver of this anomaly was an on-chain whale depositing 13,739 ETH (approximately $28.96 million) in concentrated fashion into a major exchange, triggering sensitive market expectations regarding short-term selling pressure. Immediately following this…
GateNews6m ago
Institution: Circle Stock Price Plunge May Be Misinterpreted, New Stablecoin Regulations Mainly Target Distribution End
Research firm Bernstein points out that the market misinterpreted the Clarity Act draft, causing Circle's stock price to plummet. The bill restricts stablecoin yield distribution, not issuance, so the impact on Circle's business model is limited. In contrast, a certain CEX needs to restructure its revenue mechanism. In the long term, restricting passive income may benefit Circle in consolidating its market position.
GateNews17m ago
Can Cardano Price Recover to ATHs as ADA Pulls Into a Price Dive Down One Final Time?
Can Cardano price recover to ATHs this year?
At the moment, the asset is preparing for a price dive down, perhaps its last.
Is the long-awaited ADA bull pump almost here?
The crypto community is watching several altcoin assets closely as many have proven to be resilient through the
CryptoNewsLand18m ago
Analysis: Bitcoin Shows Strong Signal as It Stabilizes Against Market Trends, Likely to Rebound to $75,000
Amid tensions between the US and Iran and weakening macro liquidity expectations, Bitcoin remains above $70,000, demonstrating market resilience. Despite facing multiple headwinds, price pullbacks have been limited, and analysts believe strong underlying demand could lead to a market rebound targeting $75,000.
BlockBeatNews47m ago
Bitcoin value ‘off the chart’ as BTC price metric hits record lows in 2026
Bitcoin (BTC) is “off the chart” in terms of value-for-money as price diverges from hash rate, a market analyst says.
Key points:
Bitcoin price action is diverging from hash rate to an extent never seen before.
The Bitcoin Yardstick metric shows that price is in its “deep value”
Cointelegraph1h ago
