
Date: 11 Jan 2026, 06:20 PM GMT
Key Highlights
-
Pump.fun (PUMP) posts over 6% intraday gains as broader crypto market sentiment improves.
-
The 4H chart shows a bearish ABCD harmonic pattern, with the bullish CD leg currently in play.
-
Price rebounded strongly from the 100-period moving average, reinforcing trend strength.
-
The pattern projects a potential upside move toward the $0.00296 region.
-
Holding above the $0.00225 support zone remains critical to sustain the bullish structure
The broader cryptocurrency market has regained modest upward momentum today, with both Bitcoin (BTC) and Ethereum (ETH) returning to positive territory. This improvement in sentiment has helped stabilize the altcoin space, and Pump.fun (PUMP) is emerging as one of the stronger performers, posting over a 6% intraday gain.
Beyond the short-term price bounce, PUMP’s chart structure is beginning to show a technically constructive setup that suggests additional upside could be developing.
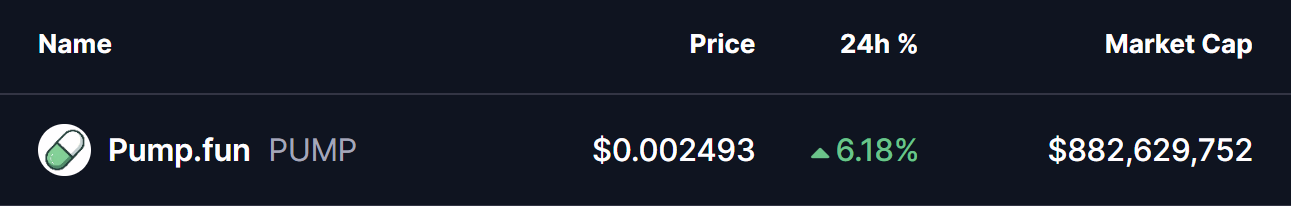
Source: Coinmarketcap
Harmonic Pattern Signals Bullish Continuation
On the 4-hour timeframe, PUMP appears to be forming a bearish ABCD harmonic pattern — a structure that often develops during the later stages of an uptrend. While this pattern can eventually signal a reversal once the final leg completes, the CD leg itself is typically driven by strong bullish momentum, often producing notable upside before any exhaustion sets in.
As illustrated on the chart, the pattern initiated at Point A near $0.00179, followed by a sharp impulsive rally into Point B around $0.00272. Price then entered a corrective phase, pulling back toward Point C near $0.00203.
Importantly, this retracement aligned closely with the 100-period moving average, where buyers stepped in decisively. The swift reaction from this zone reinforced the strength of the underlying trend and helped preserve the harmonic structure.
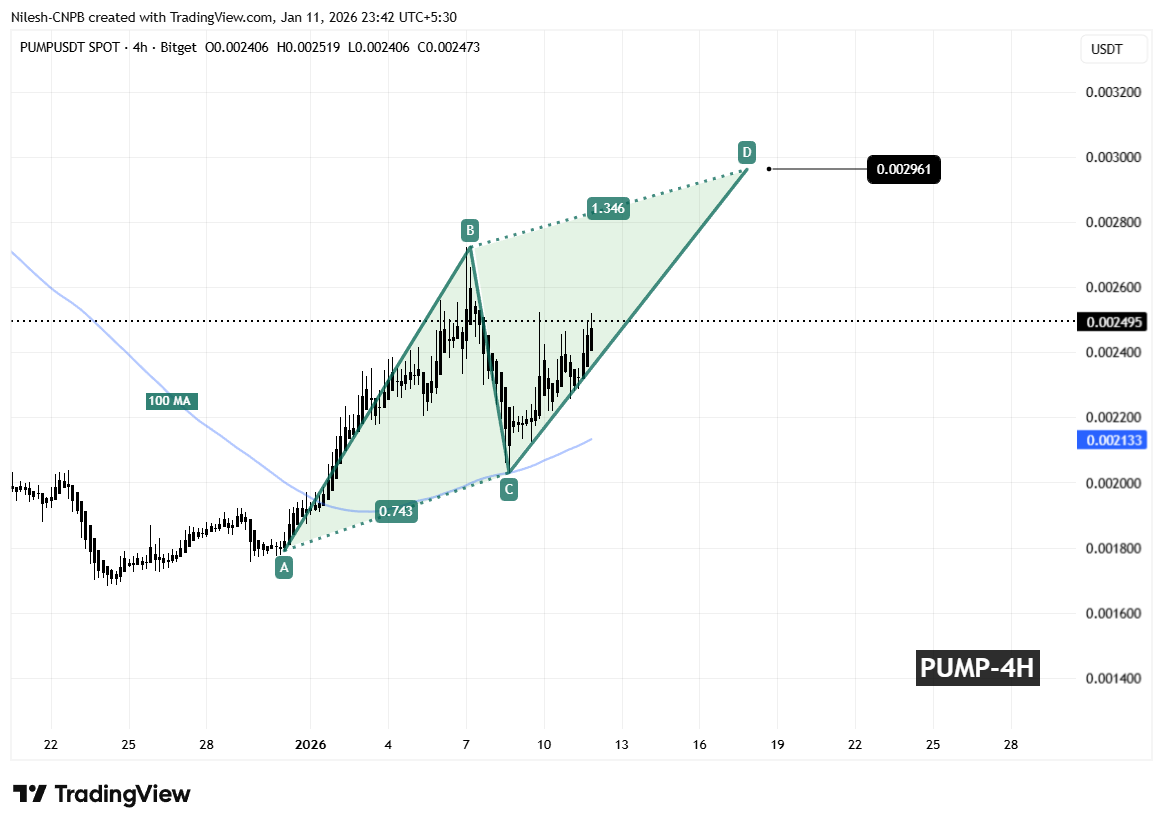
Pump.fun (PUMP) 4H Chart/Coinsprobe (Source: Tradingview)
Since bouncing from Point C, PUMP has resumed its advance and is now trading back around the $0.0025 area, signaling that the CD leg is actively unfolding.
What Could Come Next for PUMP?
If the ABCD pattern continues to play out as projected, the CD leg could extend toward the 1.346 Fibonacci projection of the BC segment. This places the Potential Reversal Zone (PRZ) near $0.00296, which sits roughly 18% above current price levels.
This zone is typically where traders begin to watch for signs of short-term exhaustion or profit-taking, as harmonic patterns often complete around these extensions. Until then, momentum favors the bulls, provided the structure remains intact.
From a risk perspective, holding above the $0.00225 support region will be crucial. A decisive breakdown below this level would weaken the harmonic setup and increase the likelihood of renewed downside pressure.
For now, PUMP’s price action remains technically constructive, with buyers defending key levels and momentum pointing toward a possible continuation higher before any broader consolidation or reversal attempt emerges.
Frequently Asked Questions (FAQ)
What is driving Pump.fun (PUMP) price higher today?
PUMP is benefiting from improving overall market sentiment and a bullish harmonic structure on the 4-hour chart, supported by strong buying interest near the 100-period moving average.
What pattern is forming on the PUMP chart?
The chart indicates a bearish ABCD harmonic pattern. While such patterns can lead to reversals at completion, the CD leg often produces strong bullish momentum before that point.
What is the upside target for Pump.fun (PUMP)?
If the CD leg continues, the projected upside target lies near the $0.00296 level, which aligns with the 1.346 Fibonacci extension.
Is Pump.fun (PUMP) still bullish in the short term?
As long as price remains above key support and momentum holds, the short-term outlook remains cautiously bullish.
Disclaimer: The views and analysis presented in this article are for informational purposes only and reflect the author’s perspective, not financial advice. Technical patterns and indicators discussed are subject to market volatility and may or may not yield the anticipated results. Investors are advised to exercise caution, conduct independent research, and make decisions aligned with their individual risk tolerance.
About Author: Nilesh Hembade is the Founder and Lead Author of Coinsprobe, with over 5 years of experience in the cryptocurrency and blockchain industry. Since launching Coinsprobe in 2023, he has been providing daily, research-driven insights through in-depth market analysis, on-chain data, and technical research.
Disclaimer: The information on this page may come from third parties and does not represent the views or opinions of Gate. The content displayed on this page is for reference only and does not constitute any financial, investment, or legal advice. Gate does not guarantee the accuracy or completeness of the information and shall not be liable for any losses arising from the use of this information. Virtual asset investments carry high risks and are subject to significant price volatility. You may lose all of your invested principal. Please fully understand the relevant risks and make prudent decisions based on your own financial situation and risk tolerance. For details, please refer to
Disclaimer.
Related Articles
Why is Bitcoin down today? Trump’s “Stone Age” comments trigger a $440 million liquidation
Trump, in a speech on April 2, warned Iran, causing market risk sentiment to contract sharply; Bitcoin fell by about 4%, hitting a low of $65,789. Rising oil prices and a strengthening dollar index intensified macro pressure, further impacting the market. From a technical perspective, Bitcoin may face a key support level at $64,000.
MarketWhisper9m ago
Today’s Crypto Fear and Greed Index has fallen to 9, and the market is in extreme fear.
Gate News message, April 3, Alternative.me data shows that today’s Crypto Fear and Greed Index fell to 9, and the market is in an “extreme fear” state. Yesterday, the index was 12, also in an “extreme fear” state.
GateNews27m ago
Retail Investors Abandoned XRP but Ripple Whales Have Stepped Up: Analyst
A very “ideal situation” for XRP has developed over the past few months, claimed a popular market observer, indicating that large whales have become the dominant buying force behind the asset.
Their comments come as the price of Ripple’s cross-border token has struggled over the past seven days, po
CryptoPotato1h ago
The Good and Bad News for Ethereum (ETH) After Dumping Below $2K
ETH joined the market-wide correction over the past few days, dropping from $2,200 to a three-week low of $1,970 before it recovered slightly to the current $2,000.
This is the asset’s most crucial level for the time being, and it’s close to breaking below it. As such, analysts have rushed to
CryptoPotato2h ago
Bittensor (TAO) Rises 10% Daily as Bulls Eye Further Breakout
The cryptocurrency market registered a slight rebound over the past 24 hours, with Bittensor (TAO) being the best performer (at least among the top 100 club) today.
Market experts expect the bullish momentum to continue, projecting more substantial gains in the near future.
TAO Jumps
CryptoPotato2h ago
MemeCore (M) Flips Shiba Inu (SHIB) After Exploding by 50% in 2 Weeks: What Comes Next?
The crypto market has a new rock star, and its name is the Solana-based meme coin MemeCore (M).
Its price has jumped by double digits in a matter of weeks, thus outperforming multiple leading cryptocurrencies like Bitcoin (BTC), Ethereum (ETH), and many more, which have been struggling during the o
CryptoPotato2h ago
