
Key Highlights
-
COW price jumps over 9% in 24 hours following CoW Swap’s launch on the Plasma Network
-
Power of 3 (PO3) pattern forming, often seen near market cycle lows
-
Price now attempting to reclaim $0.2450 support, signaling potential expansion phase
-
200-day moving average near $0.2832 stands as the next key resistance
-
Successful breakout could open upside toward $0.50 and $0.84
Cow Protocol’s native token COW is showing renewed strength after weeks of muted price action, rising over 9% in the last 24 hours following the latest ecosystem update announcing CoW Swap going live on the Plasma Network, a stablecoin-native Layer-1 focused on real-world payments.
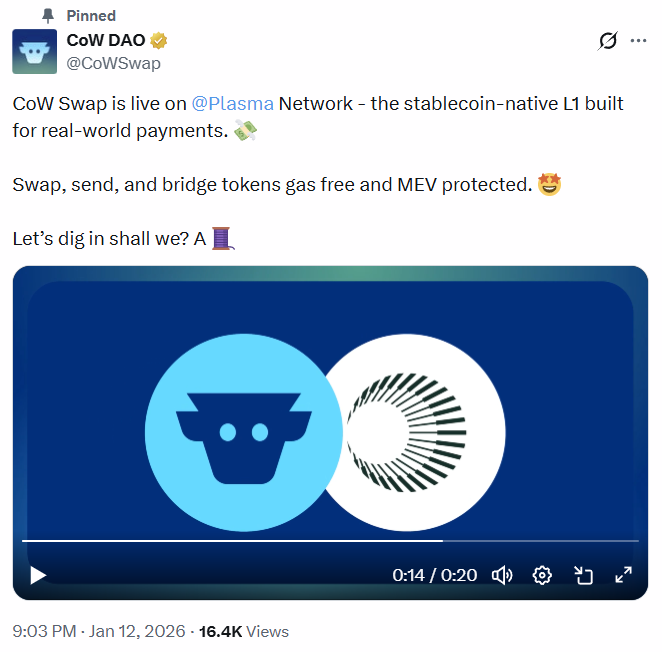
Source: @CoWSwap (X)
Beyond the short-term price pop, the daily chart structure is beginning to tell a much more interesting story, with a classic market cycle pattern quietly taking shape that could signal a larger directional move ahead.
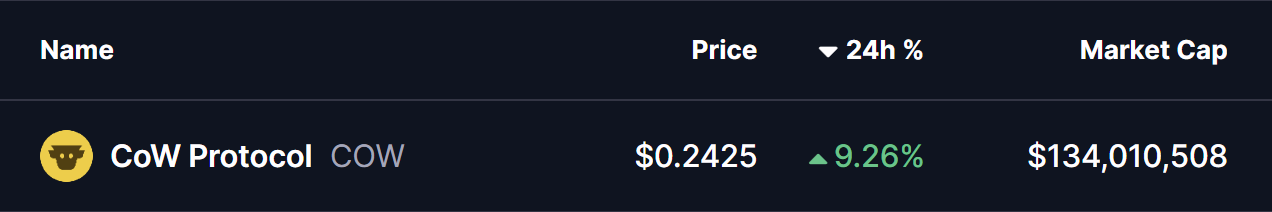
Source: Coinmarketcap
Power of 3 Pattern Taking Shape on the Chart
From a technical perspective, COW appears to be forming a Power of 3 (PO3) pattern, a structure often seen near market bottoms and early trend transitions. This pattern typically unfolds in three distinct phases: accumulation, manipulation, and expansion — with the most aggressive price movement usually occurring once the final phase begins.
Accumulation Phase: Range-Bound Base Formation
Earlier in the year, COW spent several months trading sideways inside a clearly defined range, capped by resistance near $0.50 and supported around the $0.2450 level.
This prolonged consolidation — highlighted by the gray zone on the chart — reflected steady accumulation, where long-term participants gradually built positions while volatility remained compressed. During this phase, price respected range boundaries, suggesting equilibrium between buyers and sellers rather than trend continuation.
Manipulation Phase: Liquidity Sweep Below Support
As broader market conditions weakened, COW briefly broke down below its accumulation support at $0.2450, sliding sharply toward a local low near $0.16.
This move — marked by the red-shaded zone — aligns closely with the manipulation phase of the Power of 3 pattern. Such breakdowns are often designed to trigger stop losses, shake out weak hands, and push sentiment decisively bearish.
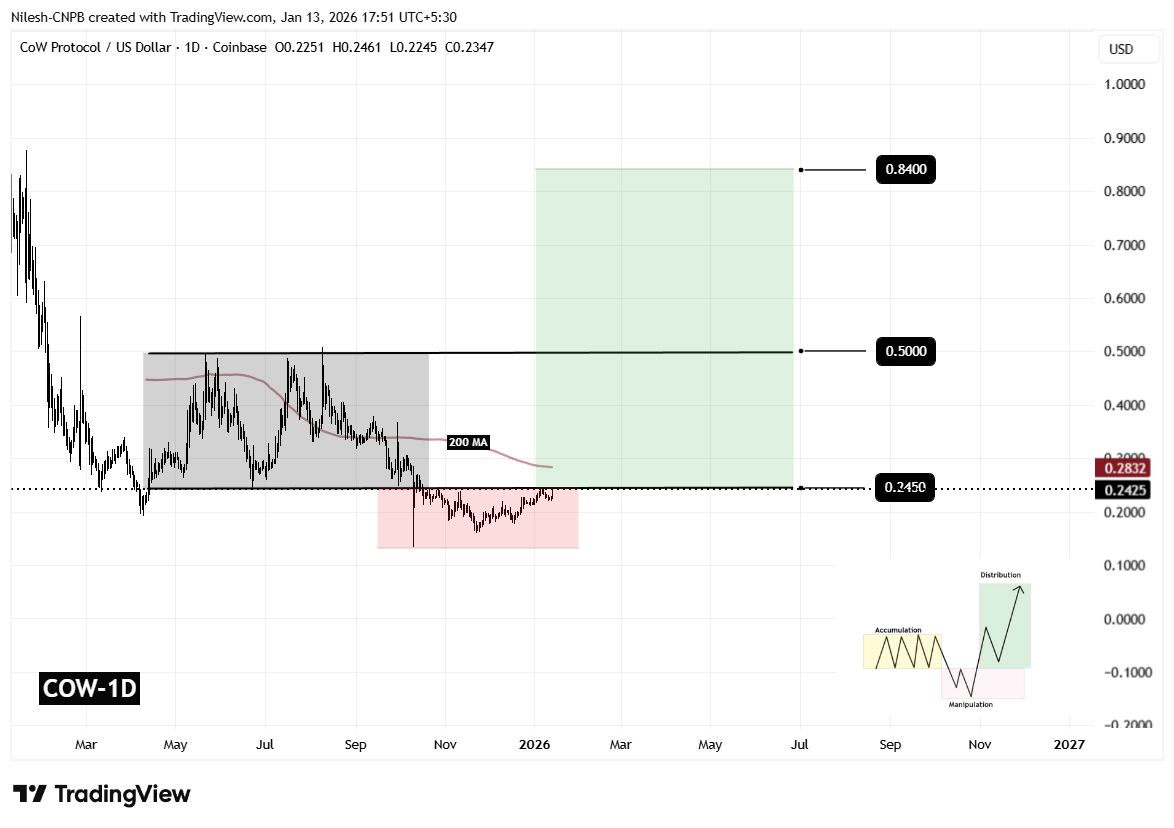
Cow Protocol (COW) Daily Chart/Coinsprobe (Source: Tradingview)
Crucially, the sell-off was short-lived. Buyers stepped in aggressively near the lows, absorbing sell pressure and preventing a sustained breakdown — an early sign that downside momentum may have been exhausted.
Expansion Phase: Is the Upside Move Beginning?
Following the liquidity sweep, COW has rebounded and is now attempting to reclaim the $0.2450 level as support. This recovery suggests the potential transition into the expansion phase, where price begins to trend away from the accumulation range.
The sharp reaction from this support zone increases the likelihood that the recent dip was corrective rather than structural, reinforcing the bullish PO3 thesis.
What’s Next for COW?
With price stabilizing above reclaimed support, attention now turns to the 200-day moving average, currently positioned near $0.2832. This level has acted as dynamic resistance and remains a key confirmation point for bulls.
-
A sustained daily close above the 200 MA would strengthen bullish momentum and increase the probability of a move toward $0.50, the top of the prior accumulation range.
-
If COW successfully reclaims and holds this zone, the Power of 3 measured move projection points to a potential upside target near $0.84, derived by extending the height of the accumulation range from the breakout level.
On the downside, failure to hold above the reclaimed support could delay or invalidate the expansion scenario, keeping COW locked in broader consolidation for longer.
Final Outlook
COW is now trading at a technically critical inflection point. The combination of a completed liquidity sweep, reclaim of key support, and improving structure suggests that a larger upside move may be developing — but confirmation remains essential.
The coming sessions will be decisive in determining whether this rebound evolves into a sustained trend or stalls below major resistance.
Frequently Asked Questions (FAQ)
What is Cow Protocol (COW)?
Cow Protocol is a decentralized finance (DeFi) platform focused on MEV-protected trading and optimal order execution, with COW serving as its native utility and governance token.
Why is COW price rising today?
COW gained momentum after CoW Swap went live on the Plasma Network, combined with a strong technical rebound from key support levels on the chart.
What is the Power of 3 pattern?
The Power of 3 (PO3) is a market structure consisting of accumulation, manipulation, and expansion phases. It often appears near market bottoms and can signal trend reversals.
What is the upside target for Cow Protocol?
If the expansion phase confirms, the projected upside target based on the PO3 pattern is around $0.84.
Is Cow Protocol a good investment?
COW shows improving technical structure, but price confirmation above resistance is still needed. Investors should conduct their own research and manage risk accordingly.
Disclaimer: The views and analysis presented in this article are for informational purposes only and reflect the author’s perspective, not financial advice. Technical patterns and indicators discussed are subject to market volatility and may or may not yield the anticipated results. Investors are advised to exercise caution, conduct independent research, and make decisions aligned with their individual risk tolerance.
About Author: Nilesh Hembade is the Founder and Lead Author of Coinsprobe, with over 5 years of experience in the cryptocurrency and blockchain industry. Since launching Coinsprobe in 2023, he has been providing daily, research-driven insights through in-depth market analysis, on-chain data, and technical research.
Disclaimer: The information on this page may come from third parties and does not represent the views or opinions of Gate. The content displayed on this page is for reference only and does not constitute any financial, investment, or legal advice. Gate does not guarantee the accuracy or completeness of the information and shall not be liable for any losses arising from the use of this information. Virtual asset investments carry high risks and are subject to significant price volatility. You may lose all of your invested principal. Please fully understand the relevant risks and make prudent decisions based on your own financial situation and risk tolerance. For details, please refer to
Disclaimer.
Related Articles
Bitcoin ETFs Shed Nearly $300M as Risk-Off Pressure Builds Across Markets
U.S. spot Bitcoin ETFs experienced approximately $296 million in net outflows from March 24 to March 27 due to growing market risk aversion amidst geopolitical and macroeconomic pressures, indicating broader investor de-risking trends.
CryptoNewsFlash5m ago
XRP Price News: On-Chain Outflows Surge, Possibly Signaling Potential Demand; XRP’s April Average Return Rate Is About 24.8%
XRP has been weak over the past 24 hours, falling more than 2%. Despite the short-term pullback, its on-chain activity and withdrawal transaction volume have rebounded, suggesting investors’ long-term willingness to hold the asset. Analysis indicates that seasonal factors may present an opportunity for XRP to move higher, and traders should monitor outflow transaction dynamics to gauge its future direction.
GateNews7m ago
Bitcoin Floor Models Point to a Potential Bottom Near $46K as Capital Weakens
Bitcoin's onchain models indicate a potential bottom between $46,000 and $54, according to analyst Willy Woo. While historical support remains, declining capital raises concerns about the model's reliability amid changing market conditions.
CryptoNewsFlash10m ago
17.83% Plunge for TWT: What Traders Should Know
Trust Wallet Token (TWT) experienced a rapid 17.83% drop in just 15 minutes, reflecting broader market volatility. With trading volume at $4 million and mixed market signals, traders are monitoring key support and resistance levels for future direction.
Coinfomania22m ago
The Bitcoin Fear and Greed Index has fallen to 8, hitting a new low for the current cycle, with fear persisting for nearly 60 days. When will the market bottom out?
Bitcoin market sentiment remains depressed, and the Fear and Greed Index has fallen to 8. It has been at extreme fear for 59 days, mainly driven by high interest rates and the global economic environment. Despite retail traders’ low sentiment, long-term holders are still transferring assets. The market faces structural disagreement, and future price action will depend on changes in macro liquidity.
GateNews28m ago
Trump speaks out, combined with Iran calling for more, and the S&P 500 surged by $90 billion overnight
By the end of March 2026, due to remarks by Iran’s parliamentary speaker and comments by Trump that influenced the U.S. stock market sentiment, the U.S. stock market experienced volatility, and the S&P 500’s market capitalization rebounded by approximately $900 billion in the short term. The market is highly sensitive and responds noticeably to political statements. Despite the stock market rebound, oil prices remain high, and ongoing geopolitical impacts continue to attract investor attention; the future market trend will depend on the progress of negotiations.
GateNews29m ago
