
Key Takeaways
-
Zcash (ZEC) is trading near the $396–$397 range after losing momentum following a sharp 2025 rally.
-
The resignation of Zcash’s core development team triggered strong selling pressure and weakened market confidence.
-
The daily chart shows a descending triangle, a bearish continuation pattern signaling increasing seller control.
As of January 18, 2026,** Zcash (ZEC) **is trading around the $396–$397 range, extending its recent weakness with a nearly 2.5% drop over the last 24 hours. While the move may look modest on the surface, it reflects a broader shift in sentiment following ZEC’s explosive 2025 rally, where the privacy-focused coin surged more than 800% at its peak.
That momentum has clearly faded in early 2026, and both fundamentals and technicals are now flashing caution signals.
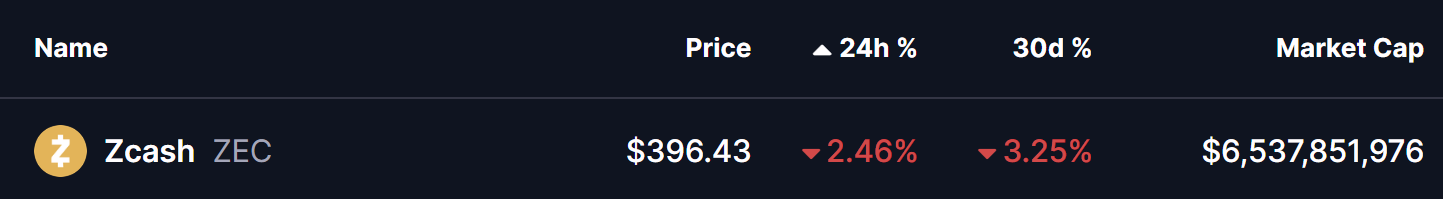
Source: Coinmarketcap
Developer Exodus Shakes Confidence
The biggest overhang for Zcash came earlier this month when the entire core development team at Electric Coin Company (ECC) stepped down. The resignations, which occurred around January 7–8, were linked to governance disputes with the Bootstrap nonprofit board overseeing the project.
Markets reacted swiftly. ZEC sold off sharply from the $480–$500 region, erasing weeks of gains in a matter of days. For a project built around long-term cryptographic research and privacy innovation, uncertainty around leadership and development direction has weighed heavily on investor confidence.
Descending Triangle Takes Shape
From a technical standpoint, Zcash’s daily chart now shows a clear descending triangle, a structure that typically signals bearish continuation after a strong uptrend.
The pattern is defined by:
-
A flat support zone between $300 and $335, which has repeatedly attracted buyers.
-
A series of lower highs, forming a downward-sloping resistance line from the 2025 peak near $750.
As price compresses within this triangle, volatility has steadily declined — often a precursor to a decisive move. Adding to the bearish bias, the 100-day moving average continues to cap upside attempts, acting as dynamic resistance during recent rebounds.
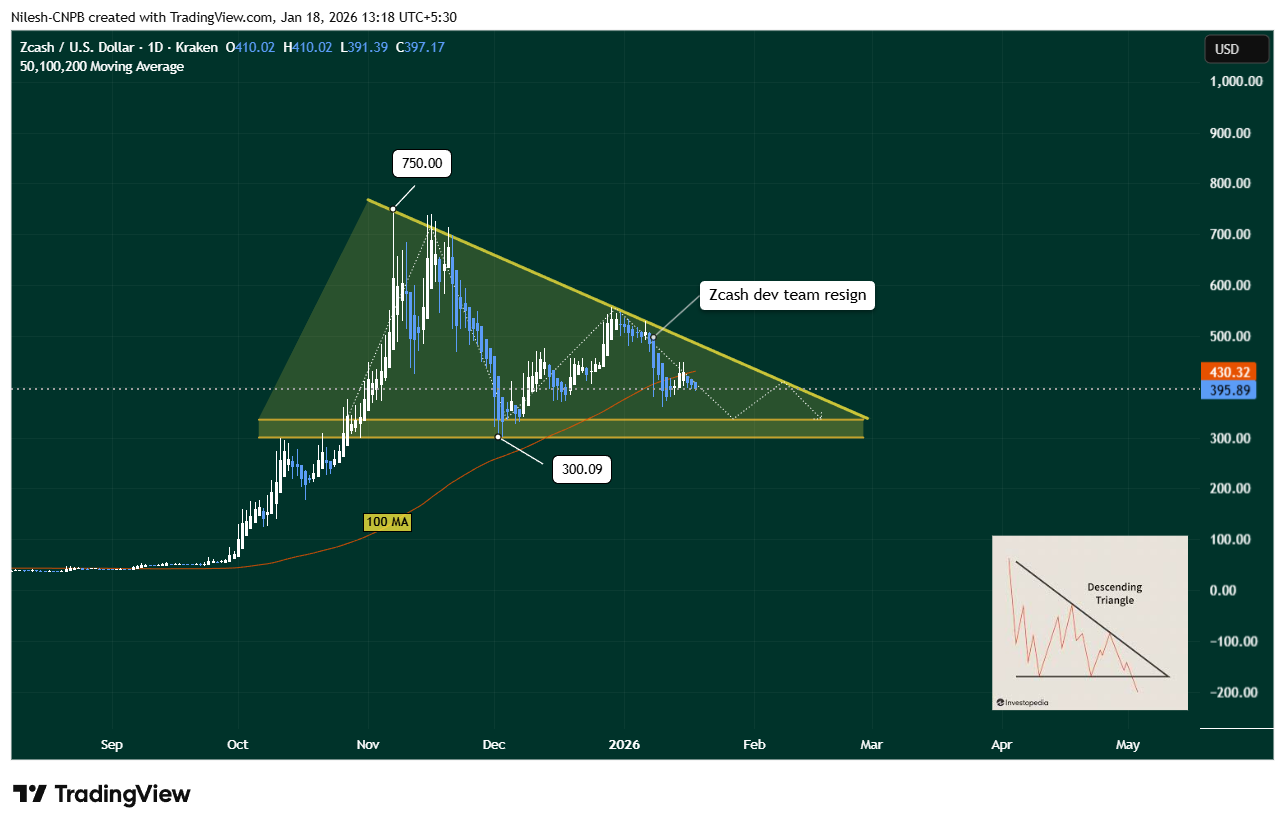
Zcash (ZEC) Daily Chart/Coinsprobe (Source: Tradingview)
The chart also highlights how the sharp sell-off began almost immediately after the developer resignation news, reinforcing the connection between fundamentals and technical weakness.
What’s Next for ZEC?
If bearish pressure persists, ZEC could gradually slide toward the lower boundary of the triangle, putting the $300–$335 support zone back in focus. A clean breakdown below this area would significantly weaken the structure and could trigger a deeper corrective phase.
On the flip side, bears would lose control if buyers manage to reclaim the 100-day moving average near $430. Such a move would signal renewed demand and could ease concerns tied to the descending triangle, at least in the short term.
Bottom Line
Zcash remains one of the most recognizable privacy-focused cryptocurrencies, but the current setup suggests caution. The combination of developer uncertainty and a bearish chart pattern has shifted momentum firmly in favor of sellers for now.
Until ZEC either breaks down from its descending triangle or reclaims key resistance levels, the token is likely to remain range-bound with a bearish tilt. How price behaves near the $300 support zone will be critical in defining Zcash’s next major move.
For traders and long-term holders alike, patience may be the best strategy as the market waits for clarity — both on the charts and within Zcash’s leadership structure.
Disclaimer: The views and analysis presented in this article are for informational purposes only and reflect the author’s perspective, not financial advice. Technical patterns and indicators discussed are subject to market volatility and may or may not yield the anticipated results. Investors are advised to exercise caution, conduct independent research, and make decisions aligned with their individual risk tolerance.
About Author: Nilesh Hembade is the Founder and Lead Author of Coinsprobe, with over 5 years of experience in the cryptocurrency and blockchain industry. Since launching Coinsprobe in 2023, he has been providing daily, research-driven insights through in-depth market analysis, on-chain data, and technical research.
Disclaimer: The information on this page may come from third parties and does not represent the views or opinions of Gate. The content displayed on this page is for reference only and does not constitute any financial, investment, or legal advice. Gate does not guarantee the accuracy or completeness of the information and shall not be liable for any losses arising from the use of this information. Virtual asset investments carry high risks and are subject to significant price volatility. You may lose all of your invested principal. Please fully understand the relevant risks and make prudent decisions based on your own financial situation and risk tolerance. For details, please refer to
Disclaimer.
Related Articles
Bitcoin traders keep chasing Trump’s Iran noise. The real signals are elsewhere.
The past four weeks have been brutal for bitcoin BTC$66,462.68 traders as prices keep chasing comments by President Donald Trump, who can't make up his mind about Iran.
One day, he talks peace and BTC and risk assets go up while oil drops, the next day he talks hawkish again, sending BTC down and o
CoinDesk27m ago
Stop fixating on Trump’s remarks? The real Bitcoin price movement signals are in the tanker rates and insurance premiums
Bitcoin is trading sideways near $66,000, influenced by remarks by Trump on the situation in Iran. The shipping and insurance costs in the Strait of Hormuz reflect elevated risk. It is expected that an expanding supply shortfall will continue to weigh on Bitcoin and other risk assets, and in the short term the market may still remain choppy.
GateNews40m ago
Bitcoin, ether, solana slide further as Trump threatens to hit Iran 'extremely hard'
Bitcoin and major cryptocurrencies fell sharply after Trump's address threatened escalated military action against Iran, reversing a previous rally. The ongoing conflict continues to create volatility in the market. Despite historical April gains, optimism is tempered by geopolitical tensions.
CoinDesk1h ago
Trump makes a tough statement to pressure Iran, Bitcoin falls below a key level, and the crypto market is under pressure again
Driven by the impact of Trump’s hardline remarks toward Iran, the crypto market weakened, with Bitcoin and Ethereum falling to $66,609 and $2,056, respectively. Market panic sentiment intensified, and the Fear & Greed Index dropped to 8. War risk pushed energy prices up, suppressing the valuations of risk assets, and in the short term volatility in crypto assets could increase.
GateNews1h ago
Trump’s “Stone Age” speech threatens to seriously hit the market; Bitcoin’s price gives back its gains
U.S. President Trump threatened in a speech to launch even harsher strikes against Iran. The market reacted sharply: Bitcoin and the stock market fell significantly, and oil prices surged. Iran has no intention of backing down and is pushing for legislation on permanent tolls, showing that tensions between the two countries have not eased. The market believes a ceasefire cannot be achieved quickly.
MarketWhisper2h ago
Trump says the Strait of Hormuz will be made “naturally open,” and the market shows disagreement through selling off
Trump expressed optimism in his speech about Iran’s military actions, saying the Strait of Hormuz will be “naturally open,” but he did not provide a specific plan, leading markets to sell off. Iran, in turn, made no concessions and plans to pass legislation to collect transit fees, further increasing uncertainty. The market reaction shows that risk assets underwent broad repricing.
MarketWhisper2h ago
