
Key Takeaways
-
Fartcoin (FARTCOIN) is trading near $0.33 amid a broader crypto market sell-off driven by macro uncertainty.
-
The 4H chart shows a Bullish Bat harmonic pattern, often associated with short-term trend reversals.
-
Price has reacted positively from the D-point support near $0.288, hinting at seller exhaustion.
-
A breakout above the 50-period moving average around $0.374 could confirm bullish momentum.
-
Harmonic targets point toward $0.404 and $0.476 if the pattern plays out successfully.
-
A breakdown below $0.288 would invalidate the bullish setup.
As of January 19, 2026, Fartcoin (FARTCOIN) is trading slightly lower around $0.33, moving in line with the broader crypto market pullback. The sell-off was triggered by escalating US–EU trade tensions, which sparked nearly $875 million in long liquidations and pushed major assets like Bitcoin (BTC) and Ethereum (ETH) down more than 2% over the past 24 hours.
While FARTCOIN is down over 3% at the time of writing, the price action beneath the surface tells a more interesting story. The latest chart structure is now flashing a potential bullish harmonic setup, suggesting the current dip could be more of a setup than a breakdown.
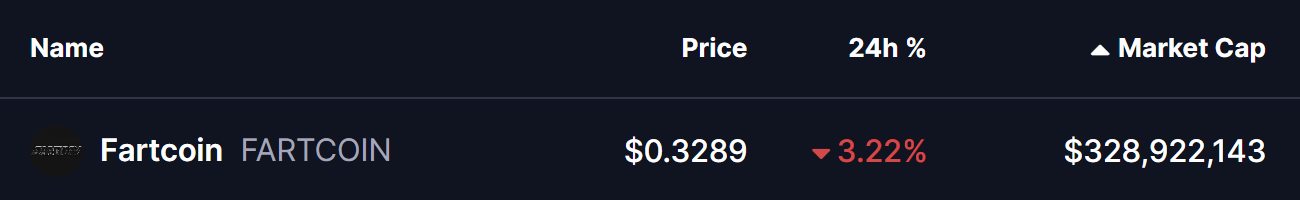
Source: Coinmarketcap
Harmonic Pattern Signals a Possible Reversal
On the 4-hour timeframe, Fartcoin is forming a well-defined Bullish Bat harmonic pattern, a structure often associated with short-term reversals after corrective phases.
The pattern began with the X point near $0.258, followed by a strong impulsive rally toward point A. Price then retraced to point B, rebounded to point C, and finally completed the structure at point D near $0.288. This D zone typically acts as the potential reversal area for the Bat pattern.
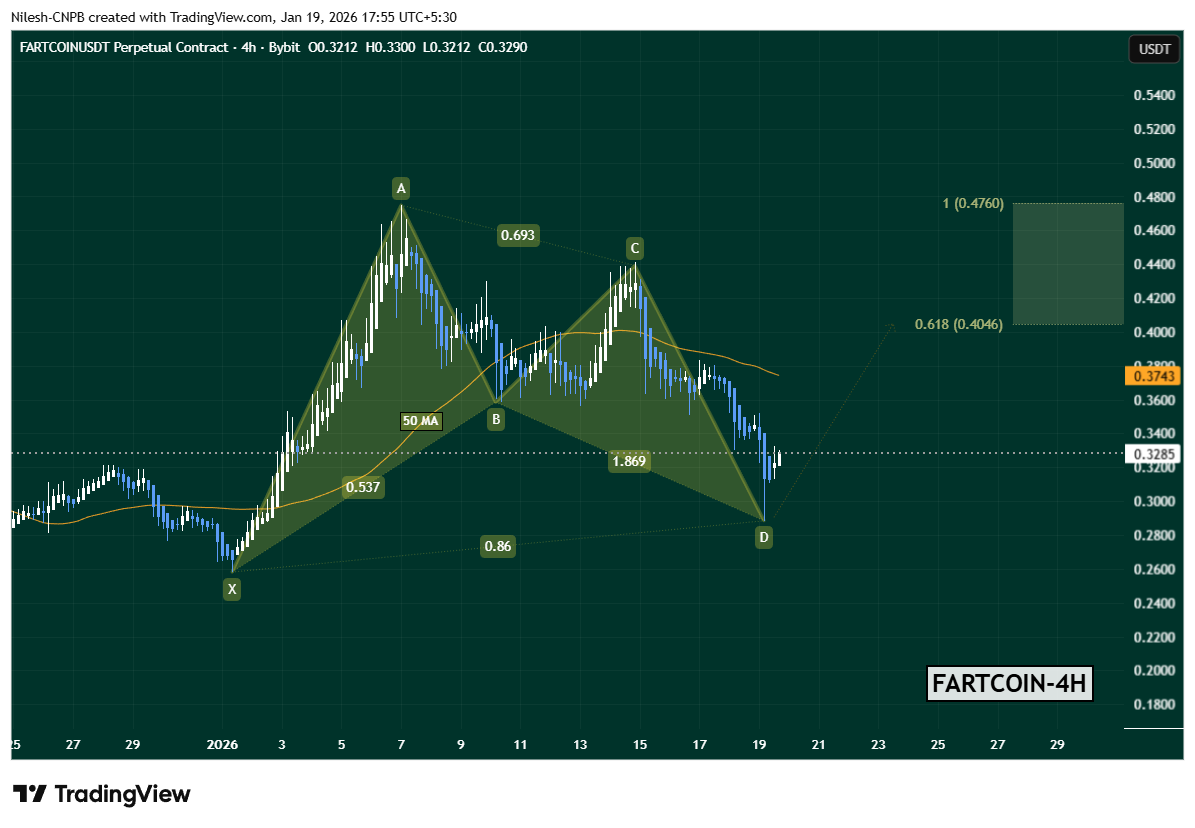
FARTCOIN Daily Chart/Coinsprobe (Source: Tradingview)
Following the completion of point D, FARTCOIN has already shown early signs of stabilization, bouncing back toward $0.3285. This initial reaction suggests that sellers may be losing momentum at current levels.
Key Levels That Could Decide the Move
One key level now in focus is the 50-period moving average, currently hovering around $0.3743. This level has acted as dynamic resistance in recent sessions and will likely determine whether the rebound gains traction or fades.
If buyers manage to push FARTCOIN above the 50 MA with improving volume, the harmonic projection opens the door for upside targets around:
This zone historically represents the area where Bat-pattern-driven moves tend to pause or face profit-taking.
On the flip side, the bullish setup remains valid only as long as price holds above the D-point support near $0.288. A decisive breakdown below this level would invalidate the harmonic structure and could expose FARTCOIN to deeper downside before any meaningful recovery attempt.
Bottom Line
Despite the ongoing market-wide weakness, Fartcoin’s chart is showing early signs of a technical rebound setup. The completion of a Bullish Bat harmonic pattern, combined with a developing bounce from key support, puts FARTCOIN at an important inflection point.
A breakout above the 50 MA could shift short-term momentum back in favor of the bulls, while failure to hold the D-point support would keep bears in control. For now, traders will be watching closely to see whether this harmonic signal translates into a sustained recovery or turns out to be another false start in a volatile market.
Disclaimer: The views and analysis presented in this article are for informational purposes only and reflect the author’s perspective, not financial advice. Technical patterns and indicators discussed are subject to market volatility and may or may not yield the anticipated results. Investors are advised to exercise caution, conduct independent research, and make decisions aligned with their individual risk tolerance.
About Author: Nilesh Hembade is the Founder and Lead Author of Coinsprobe, with over 5 years of experience in the cryptocurrency and blockchain industry. Since launching Coinsprobe in 2023, he has been providing daily, research-driven insights through in-depth market analysis, on-chain data, and technical research.
Disclaimer: The information on this page may come from third parties and does not represent the views or opinions of Gate. The content displayed on this page is for reference only and does not constitute any financial, investment, or legal advice. Gate does not guarantee the accuracy or completeness of the information and shall not be liable for any losses arising from the use of this information. Virtual asset investments carry high risks and are subject to significant price volatility. You may lose all of your invested principal. Please fully understand the relevant risks and make prudent decisions based on your own financial situation and risk tolerance. For details, please refer to
Disclaimer.
Related Articles
BTC broke through $74,000 this week, with short-term holders' profits surging to $18.4 million per hour.
Gate News reported that on March 17, according to Glassnode data, Bitcoin price made a modest breakthrough above $74,000 this week, with short-term holder realized profit (STH-Realized Profit, 12-hour simple moving average) surging to $18.4 million per hour. This is consistent with the pattern observed in February: short-term holders continuously drain momentum from each bounce at the $70,000 level, absorbing upward momentum before any real breakout can form.
GateNews9m ago
Gold Shop Gold Purchase Loss 8%! Real Test "On-Chain Gold" Token PAXG Total Fees Crush Taiwan Bank Passbook
There are three ways for Taiwanese people to buy gold: Taiwan Bank Gold Passbook, gold shops, and on-chain gold token PAXG. Surveys show that despite PAXG appearing complex, its fees are actually the lowest, at approximately 1.2-3.2%. Gold shop transaction spreads reach as high as 8%, while Taiwan Bank is 2.3%. PAXG offers 24-hour liquidity, but the threshold for redeeming physical gold is high. Your choice should consider security, fees, and liquidity needs.
動區BlockTempo15m ago
ETH Price Chart Sees Bullish Pattern on Repeat, Is $30,000 ETH ATH a Possibility?
Pioneer altcoin ETH price chart sees bullish pattern on repeat.
Another expert expects $30,000 ATH target for ETH.
How high can the price of ETH go this year?
The crypto market grows steadily bullish once again as the price of Bitcoin (BTC) reclaims prices above the $74,00 price range an
CryptoNewsLand29m ago
Crypto Analyst Points out a Bullish Possibility for XRP Price
Crypto analyst Ali Charts predicts XRP could rise to $1.85, following a recent 3.25% increase. Despite cautious community sentiment, the token's price may surge in the coming months, although a correction to $1.49 is also anticipated.
TheNewsCrypto44m ago
Crypto Fear & Greed Index Rises to 28, Exits Extreme Fear Zone
Gate News bot message, the Crypto Fear & Greed Index climbed to 28 today, up from 23 yesterday and 13 last week, transitioning from Extreme Fear into Fear territory. Market sentiment demonstrates early signs of recovery, while participants maintain a cautious stance with limited risk appetite.
GateNews56m ago
