Canton (CC), MYX Finance (MYX), and Pump.fun (PUMP) are emerging as bright spots leading the market recovery over the past 24 hours, amid the overall cryptocurrency market’s pause to “gain momentum” after a sharp correction. From a technical perspective, these altcoins are gradually approaching key resistance levels as selling pressure shows clear signs of weakening.
Notably, this recovery coincides with the easing of US–EU trade tensions, following news of a framework agreement reached during discussions between US President Donald Trump and NATO Secretary General Mark Rutte on Wednesday. The talks covered issues such as Arctic security and the $175 billion Golden Dome missile defense system, in exchange for the removal of tariffs, thereby helping to improve market sentiment.
Canton’s recovery could signal a stable upward trend
Canton Network’s flexible and customizable privacy control mechanisms are helping this project stand out as one of the layer-1 blockchains particularly favored by organizations. Notably, it supports tokenization of assets held by the Depository Trust Company (DTC), along with JP Morgan’s integration of the JPM Coin into its payment system. At press time, CC is trading around $0.15 on Thursday, after an 18% increase the previous day.
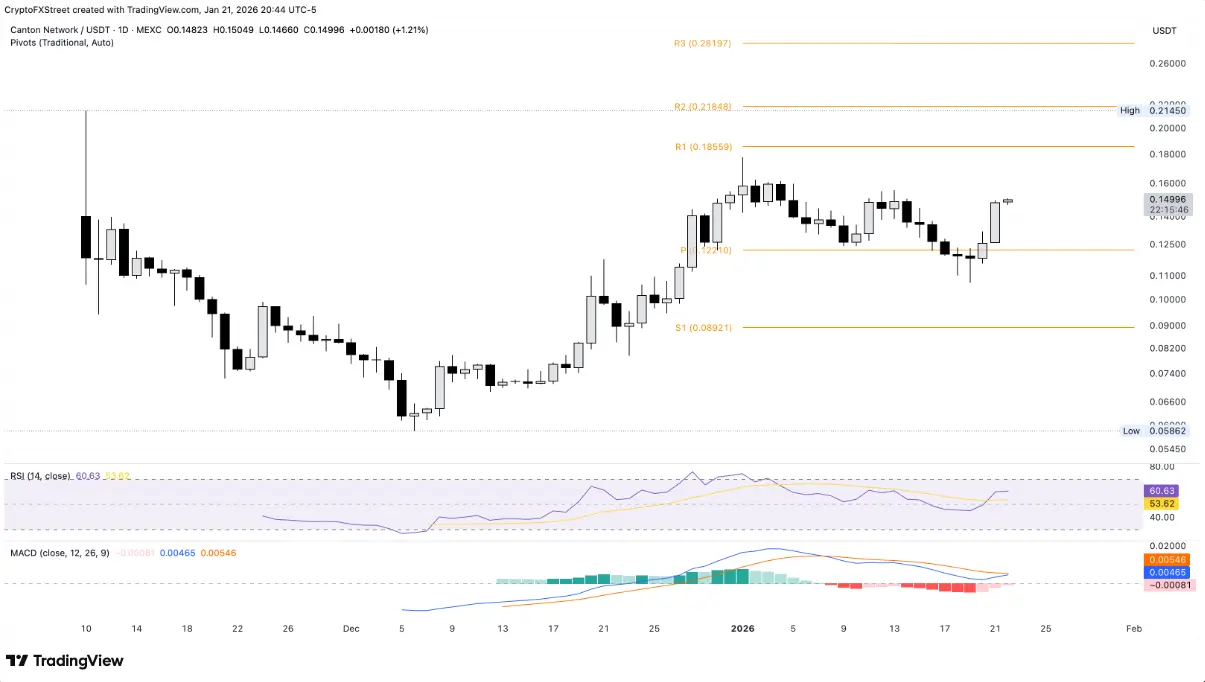 Daily CC/USDT chart | Source: TradingView The weekly recovery of CC has yielded approximately 25% profit, with buying momentum aiming to challenge the Pivot R1 level at $0.1859.
Technical indicators on the daily timeframe continue to reinforce a positive outlook as selling pressure weakens. RSI has reached 60 and is turning upward from the neutral zone, approaching overbought levels, while the MACD line is nearing the signal line, increasing expectations of a bullish crossover soon.
In a correction scenario, CC could retreat to the support zone around $0.12 – the price level established this week – before facing a key psychological support at $0.10.
MYX Finance attracts attention with expectations of breaking out of accumulation zone
MYX Finance remains in a sideways trend within an accumulation range from $4.87 to $6.07 on the daily chart. Currently, MYX is trading above $6, indicating signals of preparing to challenge the resistance zone above $6.07.
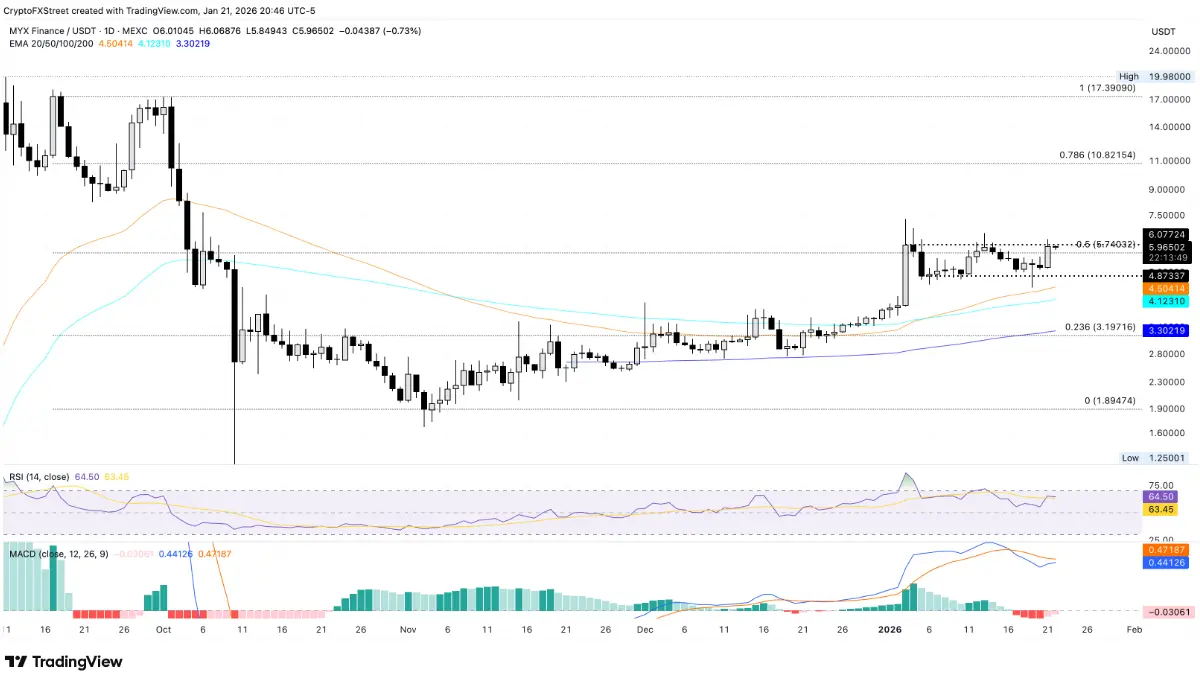 Daily MYX/USDT chart | Source: TradingView If this altcoin surpasses the above threshold, the price could open up strong upside potential, targeting the 78.6% Fibonacci retracement level at $10.82 — calculated based on the swing from the closing price of $17.39 on 9/17 to $1.89 on 11/3.
Technical indicators also support a bullish outlook: MACD is about to form a bullish crossover, while RSI has risen to 64, approaching overbought territory.
Conversely, if MYX corrects, the 50-day EMA line, currently rising around $4.50, could serve as a crucial support zone, limiting the risk of a sharp decline.
Pump.fun’s recovery on the 50-day EMA still at a crossroads
Pump.fun is currently trading around the 50-day EMA at $0.0025 as of Thursday, after a 10% increase on Wednesday. This Solana-based launchpad token aims to reach the 100-day EMA and the R1 Pivot level, approximately $0.0029, if the recovery momentum continues.
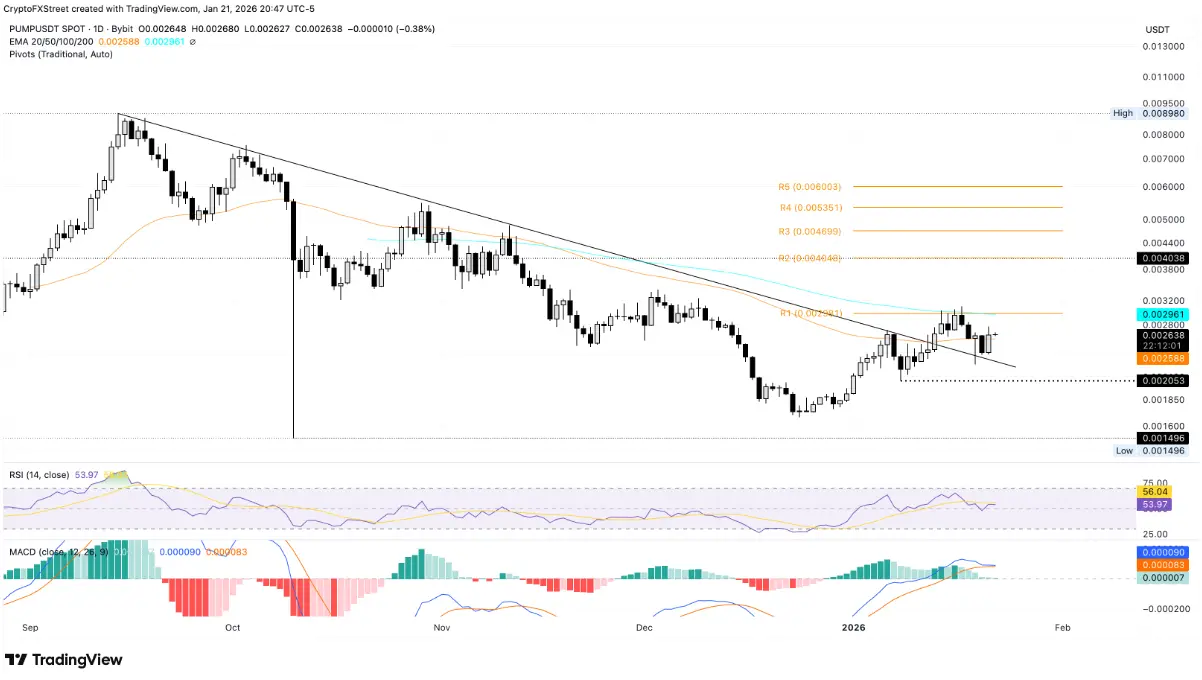 Daily PUMP/USDT chart | Source: TradingView The MACD indicator’s MACD line remains above the signal line, temporarily delaying a bearish crossover, which helps bulls maintain short-term momentum. RSI hovers around 53, above the neutral threshold, indicating a slight upward trend amid a market that remains neutral.
Conversely, if PUMP suddenly reverses, selling pressure could push the price back to the round level of $0.0020.
Disclaimer: The information on this page may come from third parties and does not represent the views or opinions of Gate. The content displayed on this page is for reference only and does not constitute any financial, investment, or legal advice. Gate does not guarantee the accuracy or completeness of the information and shall not be liable for any losses arising from the use of this information. Virtual asset investments carry high risks and are subject to significant price volatility. You may lose all of your invested principal. Please fully understand the relevant risks and make prudent decisions based on your own financial situation and risk tolerance. For details, please refer to
Disclaimer.
Related Articles
These catalysts could bump bitcoin as Trump hands three-week target to end Iran war
Asian stocks posted their best day in months and S&P 500 futures jumped after the president said he would address the nation Wednesday night with an "important update" on Iran. Oil pared losses as the UAE reportedly prepares to help reopen the Strait of Hormuz by force.
Bitcoin traded at $67,950 on
CoinDesk7m ago
Are Trump’s expectations of an Iran war heating up after three weeks—are the catalysts for Bitcoin’s rise continuing to accumulate?
As expectations grow that a Trump-led Iran war will end within two to three weeks, global risk-asset sentiment has rebounded. Bitcoin is holding at $67,950, Asia-Pacific equities are performing strongly, and overall market risk appetite has recovered. Institutional capital is flowing into the crypto market, which could push Bitcoin toward a clear direction. The market is waiting for Trump’s key speech to confirm the trend.
GateNews9m ago
Sell-off warning lights are flashing red! 47% of circulating Bitcoin has been “trapped,” and long-term holders are also taking losses and cashing out
The cryptocurrency market is facing a cold wind: nearly half of Bitcoin has already fallen below its cost basis, and long-term investors have also begun to realize losses and sell. The Bitcoin Impact Index rose to 57.4, indicating that market pressure is intensifying; historically, similar situations have signaled that large-scale sell-offs are about to come. Short-term holders are down 47%, capital momentum has weakened, and stablecoin outflows have turned into net inflows in reverse.
区块客16m ago
Analyst: April could be a key observation period for Bitcoin; the RSI is in the neutral range, and volatility may rise
April is typically a stronger month for Bitcoin’s performance, with a historical average monthly gain of about 11.3%. But since 2020, this pattern has become less stable. Bitcoin’s relative strength indicator is currently 47%, and market sentiment is being influenced by geopolitical and inflation concerns. This suggests that April’s volatility may rise, so it’s important to watch whether the market can form a clear direction.
GateNews1h ago
The Old Token Playbook Is Dead: Why Most Crypto Launches Failed in 2025
The old “token playbook” is over, according to 21Shares researcher Darius Moukhtarzade, who said that launching at high FDV, low float with a governance “meme coin” does not work anymore.
Moukhtarzade explained that there is a widening “sentiment-fundamentals gap” as the core reason behind
CryptoPotato1h ago
ETH 15-minute up 0.62%: Driven by ETF net inflows and a liquidity squeeze, short-term strength builds
2026-04-01 03:00 to 03:15 (UTC), the ETH price saw unusual movement, with a range return of +0.62%. The lowest point of the candlestick was 2088.43 USDT, and the highest point was 2106.93 USDT, with a swing of 0.89%. Against the backdrop of heightened volatility across crypto assets, ETH’s short-term trading activity was active, on-chain interest increased, and market attention rose significantly.
The main driver behind this unusual move is that net inflows into U.S. spot ETFs have continued to be amplified. ETF net inflows in early April continued the strong momentum from late March, driving a significant increase in spot demand for ETH.
GateNews2h ago
