
Key Takeaways
-
Hyperliquid (HYPE) surged over 8%, reclaiming the $23.30 level amid rising market interest.
-
DefiLlama data shows Hyperliquid leading perpetual futures volume over the last 30 days, topping $160 billion.
-
Strong derivatives activity suggests sustained trader demand and growing ecosystem traction.
-
The daily chart highlights a Bearish Shark harmonic pattern, allowing room for short-term upside.
Hyperliquid’s native token, HYPE, is back in the spotlight today after posting a 8%+ price jump, pushing above the $23.30 level. While the price move itself has caught traders’ attention, a deeper look at on-chain metrics and the daily chart suggests there may be more developing beneath the surface.
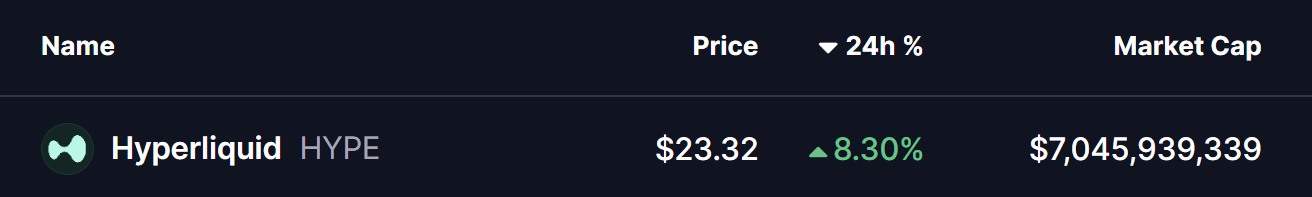
Source: Coinmarketcap
Hyperliquid (HYPE) Leads Perp Volume
According to DefiLlama data, **Hyperliquid **has emerged as the **top perpetual futures **platform by trading volume over the last 30 days, significantly outperforming its closest competitors. The protocol recorded approximately $160.4 billion in perpetual volume, comfortably ahead of Aster and Lighter, which logged around $124.7 billion and $112.5 billion, respectively.
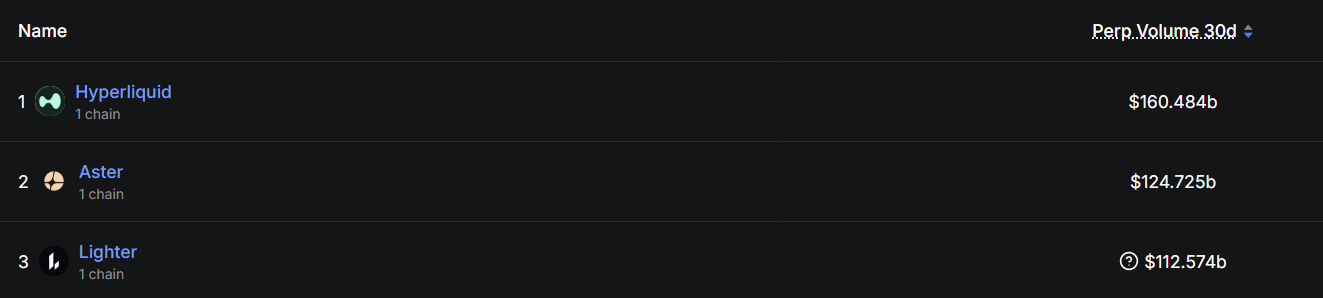
Source: Defillama
This surge in activity highlights growing trader preference for Hyperliquid’s ecosystem, signaling strong demand, deep liquidity, and sustained engagement. Historically, rising derivatives volume often acts as a leading indicator for increased interest in a project’s native token — something that appears to be playing out in HYPE’s recent price action.
Is More Upside Ahead?
From a technical perspective, HYPE’s daily chart reveals the development of a Bearish Shark harmonic pattern, a well-known formation in technical analysis. While this pattern ultimately suggests a potential reversal once fully completed, it often allows for short-term bullish continuation as price moves toward the “C” point.
Following the completion of the O-X-A-B structure, HYPE is currently trading around $23.26, holding above its recent lows. The next key challenge for bulls lies at the 50-day moving average near $25.72, which has acted as a dynamic resistance zone.
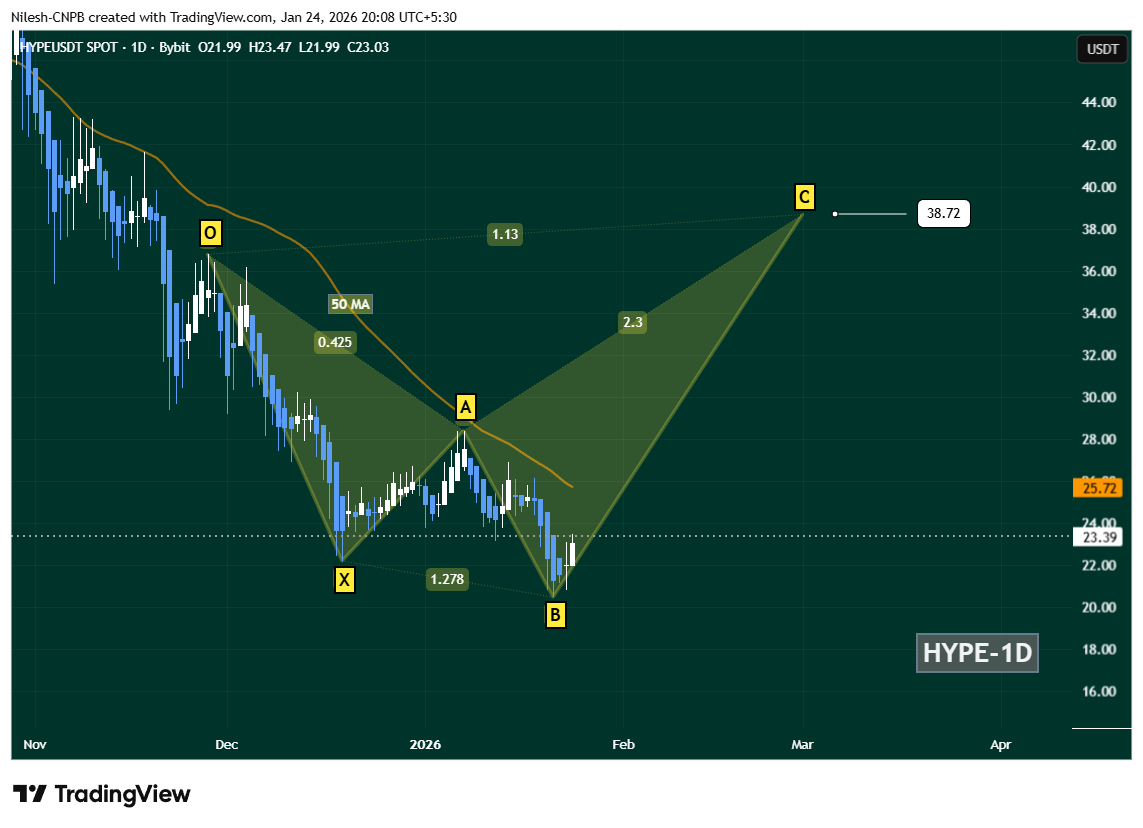
Hyperliquid (HYPE) Daily Chart/Coinsprobe (Source: Tradingview)
A decisive daily close above the 50-day MA ($25.72) would strengthen the recovery narrative and could open the door for a broader upside move. If momentum continues to build, the chart projects a potential advance toward the C-point near $38.72, aligning with the Shark pattern’s 1.13 Fibonacci extension.
However, downside risks remain. A failure to hold the B-point support zone would invalidate the bullish continuation setup and could expose HYPE to extended consolidation or further downside pressure in the near term.
Bottom Line
HYPE’s price rebound is being backed by strong on-chain fundamentals, with Hyperliquid clearly dominating the perpetual trading landscape. While the broader harmonic structure suggests caution in the longer term, short-term technicals still favor a recovery move as long as key support levels remain intact. All eyes now remain on the $25.72 reclaim, which could act as the trigger for the next leg higher.
Disclaimer: The views and analysis presented in this article are for informational purposes only and reflect the author’s perspective, not financial advice. Technical patterns and indicators discussed are subject to market volatility and may or may not yield the anticipated results. Investors are advised to exercise caution, conduct independent research, and make decisions aligned with their individual risk tolerance.
About Author: Nilesh Hembade is the Founder and Lead Author of Coinsprobe, with over 5 years of experience in the cryptocurrency and blockchain industry. Since launching Coinsprobe in 2023, he has been providing daily, research-driven insights through in-depth market analysis, on-chain data, and technical research.
Disclaimer: The information on this page may come from third parties and does not represent the views or opinions of Gate. The content displayed on this page is for reference only and does not constitute any financial, investment, or legal advice. Gate does not guarantee the accuracy or completeness of the information and shall not be liable for any losses arising from the use of this information. Virtual asset investments carry high risks and are subject to significant price volatility. You may lose all of your invested principal. Please fully understand the relevant risks and make prudent decisions based on your own financial situation and risk tolerance. For details, please refer to
Disclaimer.
Related Articles
These catalysts could bump bitcoin as Trump hands three-week target to end Iran war
Asian stocks posted their best day in months and S&P 500 futures jumped after the president said he would address the nation Wednesday night with an "important update" on Iran. Oil pared losses as the UAE reportedly prepares to help reopen the Strait of Hormuz by force.
Bitcoin traded at $67,950 on
CoinDesk6m ago
Are Trump’s expectations of an Iran war heating up after three weeks—are the catalysts for Bitcoin’s rise continuing to accumulate?
As expectations grow that a Trump-led Iran war will end within two to three weeks, global risk-asset sentiment has rebounded. Bitcoin is holding at $67,950, Asia-Pacific equities are performing strongly, and overall market risk appetite has recovered. Institutional capital is flowing into the crypto market, which could push Bitcoin toward a clear direction. The market is waiting for Trump’s key speech to confirm the trend.
GateNews8m ago
Sell-off warning lights are flashing red! 47% of circulating Bitcoin has been “trapped,” and long-term holders are also taking losses and cashing out
The cryptocurrency market is facing a cold wind: nearly half of Bitcoin has already fallen below its cost basis, and long-term investors have also begun to realize losses and sell. The Bitcoin Impact Index rose to 57.4, indicating that market pressure is intensifying; historically, similar situations have signaled that large-scale sell-offs are about to come. Short-term holders are down 47%, capital momentum has weakened, and stablecoin outflows have turned into net inflows in reverse.
区块客15m ago
Analyst: April could be a key observation period for Bitcoin; the RSI is in the neutral range, and volatility may rise
April is typically a stronger month for Bitcoin’s performance, with a historical average monthly gain of about 11.3%. But since 2020, this pattern has become less stable. Bitcoin’s relative strength indicator is currently 47%, and market sentiment is being influenced by geopolitical and inflation concerns. This suggests that April’s volatility may rise, so it’s important to watch whether the market can form a clear direction.
GateNews1h ago
The Old Token Playbook Is Dead: Why Most Crypto Launches Failed in 2025
The old “token playbook” is over, according to 21Shares researcher Darius Moukhtarzade, who said that launching at high FDV, low float with a governance “meme coin” does not work anymore.
Moukhtarzade explained that there is a widening “sentiment-fundamentals gap” as the core reason behind
CryptoPotato1h ago
ETH 15-minute up 0.62%: Driven by ETF net inflows and a liquidity squeeze, short-term strength builds
2026-04-01 03:00 to 03:15 (UTC), the ETH price saw unusual movement, with a range return of +0.62%. The lowest point of the candlestick was 2088.43 USDT, and the highest point was 2106.93 USDT, with a swing of 0.89%. Against the backdrop of heightened volatility across crypto assets, ETH’s short-term trading activity was active, on-chain interest increased, and market attention rose significantly.
The main driver behind this unusual move is that net inflows into U.S. spot ETFs have continued to be amplified. ETF net inflows in early April continued the strong momentum from late March, driving a significant increase in spot demand for ETH.
GateNews2h ago
