![]() Trusted Editorial content, reviewed by leading industry experts and seasoned editors. Ad Disclosure
Bitcoin and Ethereum spot ETFs have continued to observe weak demand as their monthly average netflows have remained in the red.
Trusted Editorial content, reviewed by leading industry experts and seasoned editors. Ad Disclosure
Bitcoin and Ethereum spot ETFs have continued to observe weak demand as their monthly average netflows have remained in the red.
Bitcoin & Ethereum Spot ETFs Have Been Observing Net Outflows
As pointed out by on-chain analytics firm Glassnode in a new post on X, the average netflow for both Bitcoin and Ethereum spot exchange-traded funds (ETFs) has remained negative recently. Spot ETFs are investment vehicles that allow investors to gain indirect exposure to an underlying asset. In the case of cryptocurrencies, this means that traders never have to interact with blockchain infrastructure themselves. Instead, the fund buys and custodies tokens on its behalf.
Related Reading: Strategy Extends Bitcoin Accumulation With New 2,932 BTC PurchaseETFs and similar investment vehicles for digital assets are available in various parts of the world, but currently, the most dominant funds are those based in the United States. The US Securities and Exchange Commission (SEC) first approved spot ETFs for Bitcoin in January 2024 and for Ethereum in July 2024. Since their establishment, ETFs have grown into a cornerstone of the market, tapping into demand from traditional institutional entities.
First, here is a chart that shows the trend in the 30-day simple moving average (SMA) of the Bitcoin spot ETF netflow over the last couple of years:
![Bitcoin Spot ETFs]()
These funds appear to have been facing a wave of outflows in recent weeks | Source: Glassnode on X
As shown in the above graph, the US Bitcoin spot ETFs saw their 30-day SMA netflow dip into negative territory back in November, suggesting net capital outflows began.
Since then, the indicator has mostly remained inside this territory, although the capital bleeding has slowed down recently. Earlier this month, the 30-day SMA netflow even flipped into the positive zone, but the net inflows lasted only briefly, with the indicator quickly returning to the red region.
A similar pattern has also been witnessed with Ethereum spot ETFs, as the chart below shows.
![Ethereum spot ETFs]()
How the 30-day SMA netflow of the US ETH spot ETFs has changed since the funds began trading | Source: Glassnode on X
From the graph, it’s visible that the US Ethereum spot ETFs have also seen their 30-day SMA netflow return to the underwater zone after a brief wave of net capital inflows.
Related Reading: Bitcoin Hashrate Slides As Foundry USA Loses 200 EH/s In US Cold SnapThis means that interest in the digital asset market as a whole continues to be down among ETF users. “There is no sign of renewed demand,” noted the analytics firm. It now remains to be seen how long the wave of outflows will go on.
BTC Price
At the time of writing, Bitcoin is floating around $88,000, down 3.5% in the last seven days.
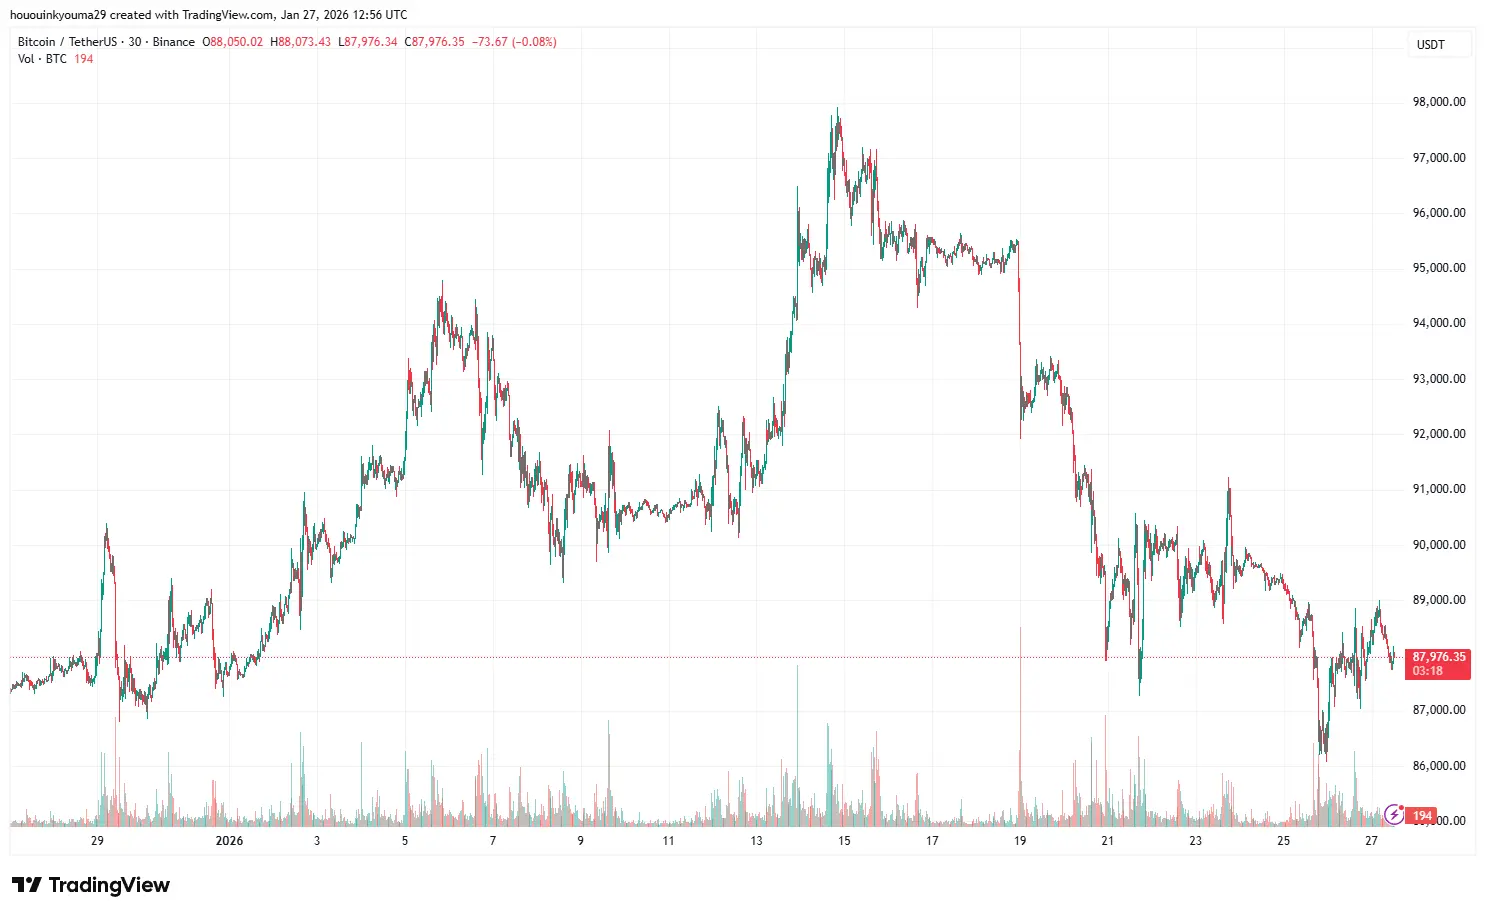
The trend in the price of the coin over the last five days | Source: BTCUSDT on TradingView
Featured image from Dall-E, chart from TradingView.com
![]() Editorial Process for bitcoinist is centered on delivering thoroughly researched, accurate, and unbiased content. We uphold strict sourcing standards, and each page undergoes diligent review by our team of top technology experts and seasoned editors. This process ensures the integrity, relevance, and value of our content for our readers.
Editorial Process for bitcoinist is centered on delivering thoroughly researched, accurate, and unbiased content. We uphold strict sourcing standards, and each page undergoes diligent review by our team of top technology experts and seasoned editors. This process ensures the integrity, relevance, and value of our content for our readers.
Disclaimer: The information on this page may come from third parties and does not represent the views or opinions of Gate. The content displayed on this page is for reference only and does not constitute any financial, investment, or legal advice. Gate does not guarantee the accuracy or completeness of the information and shall not be liable for any losses arising from the use of this information. Virtual asset investments carry high risks and are subject to significant price volatility. You may lose all of your invested principal. Please fully understand the relevant risks and make prudent decisions based on your own financial situation and risk tolerance. For details, please refer to
Disclaimer.
Related Articles
BTC is trading in a tight range around $67,000, and SOL futures open interest hits a new two-month high
On April 3, the crypto market continued to trade in choppy conditions. Bitcoin was consolidating around $67,000, maintaining its broader downward trend that began last October. The futures market saw thin trading, with Solana futures open interest hitting a new high, and the volatility index falling to its lowest level since February. Market structure indicates that short positions are increasing.
GateNews24m ago
BTC drops below $65k; the long position liquidation strength will reach $65k. Breaking above $68k, the short position liquidation strength will reach $754 million
According to Coinglass data, if Bitcoin falls below $65k, long positions on major CEXs will be liquidated to the tune of $65k; if it breaks above $68k, short positions will be liquidated to the tune of $754 million. The liquidation chart reflects the strength of the market reaction when price touches a certain level.
GateNews36m ago
Naoris Protocol's quantum-resistant blockchain goes live as Bitcoin and Ethereum face 'Q-Day' threats
Naoris Protocol launched a quantum-resistant blockchain, designed to secure transactions against future quantum threats. It utilizes post-quantum cryptography and has validated over 100 million transactions, preparing to protect digital assets despite vulnerabilities in existing systems like Bitcoin and Ethereum.
CoinDesk1h ago
Strategy common stock MSTR sees a sharp pullback, while preferred stock STRC still maintains stable returns
The Strategy Company offers two investment options for Bitcoin investors: high-risk, high-reward MSTR common stock and stable-dividend STRC preferred stock. MSTR amplifies price volatility and is suitable for high-risk investors; STRC provides an annualized 11.5% dividend and is suitable for retail investors seeking stability. The choice depends on an individual’s risk tolerance and investment goals.
GateNews1h ago
Reputed Crypto Trader Calls the Bottom at $54,000 BTC Price, Bullish Expectations Grow
Reputed crypto trader calls the bottom at $54,000 BTC price.
This led to a massive surge in price pump expectations.
The price of BTC could rally towards new ATH prices after the bottom is set.
The price of Bitcoin (BTC) continues to trade in the $66,000 price range, hinting at
CryptoNewsLand1h ago
Riot Platforms Sells 3,778 Bitcoin in Q1 2026, Raising $289.5 Million for Data Center Expansion
Riot Platforms sold 3,778 bitcoin during the first quarter of 2026, generating $289.5 million in net proceeds at an average price of $76,626 per BTC, according to the company’s official unaudited Q1 2026 production and operations update released this week.
Riot Platforms Q1 2026 Update
The
Coinpedia1h ago
