
Key Takeaways
-
Hyperliquid (HYPE) surged over 8%, reclaiming the $23.30 level amid rising market interest.
-
DefiLlama data shows Hyperliquid leading perpetual futures volume over the last 30 days, topping $160 billion.
-
Strong derivatives activity suggests sustained trader demand and growing ecosystem traction.
-
The daily chart highlights a Bearish Shark harmonic pattern, allowing room for short-term upside.
Hyperliquid’s native token, HYPE, is back in the spotlight today after posting a 8%+ price jump, pushing above the $23.30 level. While the price move itself has caught traders’ attention, a deeper look at on-chain metrics and the daily chart suggests there may be more developing beneath the surface.
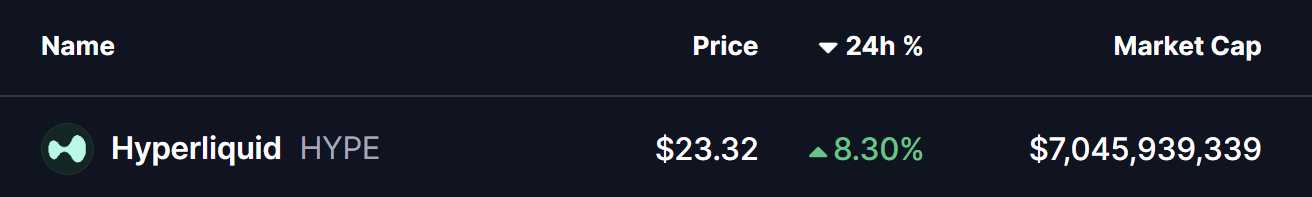
Source: Coinmarketcap
Hyperliquid (HYPE) Leads Perp Volume
According to DefiLlama data, **Hyperliquid **has emerged as the **top perpetual futures **platform by trading volume over the last 30 days, significantly outperforming its closest competitors. The protocol recorded approximately $160.4 billion in perpetual volume, comfortably ahead of Aster and Lighter, which logged around $124.7 billion and $112.5 billion, respectively.
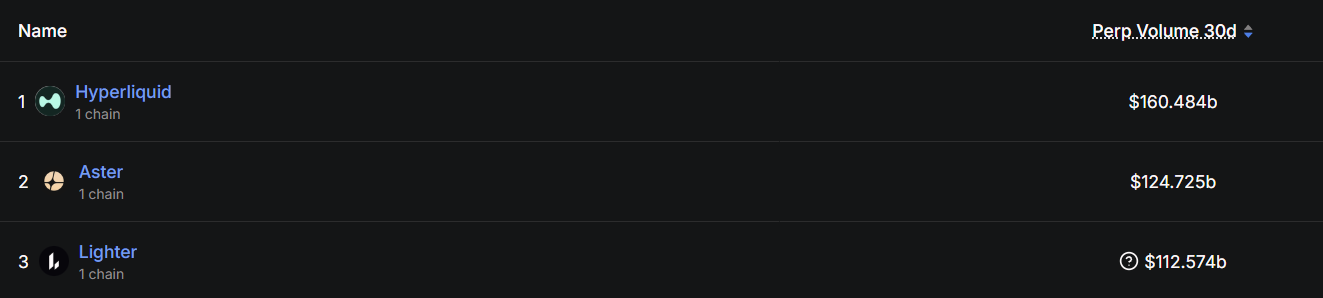
Source: Defillama
This surge in activity highlights growing trader preference for Hyperliquid’s ecosystem, signaling strong demand, deep liquidity, and sustained engagement. Historically, rising derivatives volume often acts as a leading indicator for increased interest in a project’s native token — something that appears to be playing out in HYPE’s recent price action.
Is More Upside Ahead?
From a technical perspective, HYPE’s daily chart reveals the development of a Bearish Shark harmonic pattern, a well-known formation in technical analysis. While this pattern ultimately suggests a potential reversal once fully completed, it often allows for short-term bullish continuation as price moves toward the “C” point.
Following the completion of the O-X-A-B structure, HYPE is currently trading around $23.26, holding above its recent lows. The next key challenge for bulls lies at the 50-day moving average near $25.72, which has acted as a dynamic resistance zone.
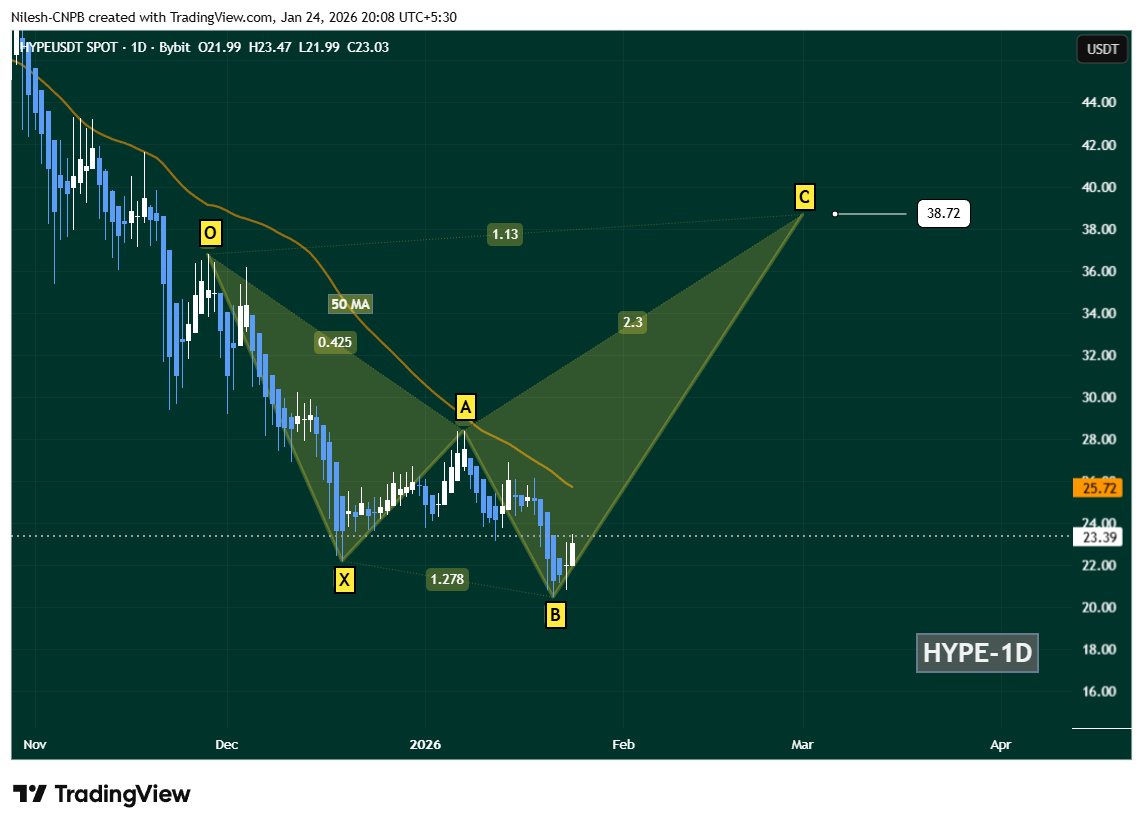
Hyperliquid (HYPE) Daily Chart/Coinsprobe (Source: Tradingview)
A decisive daily close above the 50-day MA ($25.72) would strengthen the recovery narrative and could open the door for a broader upside move. If momentum continues to build, the chart projects a potential advance toward the C-point near $38.72, aligning with the Shark pattern’s 1.13 Fibonacci extension.
However, downside risks remain. A failure to hold the B-point support zone would invalidate the bullish continuation setup and could expose HYPE to extended consolidation or further downside pressure in the near term.
Bottom Line
HYPE’s price rebound is being backed by strong on-chain fundamentals, with Hyperliquid clearly dominating the perpetual trading landscape. While the broader harmonic structure suggests caution in the longer term, short-term technicals still favor a recovery move as long as key support levels remain intact. All eyes now remain on the $25.72 reclaim, which could act as the trigger for the next leg higher.
Disclaimer: The views and analysis presented in this article are for informational purposes only and reflect the author’s perspective, not financial advice. Technical patterns and indicators discussed are subject to market volatility and may or may not yield the anticipated results. Investors are advised to exercise caution, conduct independent research, and make decisions aligned with their individual risk tolerance.
About Author: Nilesh Hembade is the Founder and Lead Author of Coinsprobe, with over 5 years of experience in the cryptocurrency and blockchain industry. Since launching Coinsprobe in 2023, he has been providing daily, research-driven insights through in-depth market analysis, on-chain data, and technical research.
Disclaimer: The information on this page may come from third parties and does not represent the views or opinions of Gate. The content displayed on this page is for reference only and does not constitute any financial, investment, or legal advice. Gate does not guarantee the accuracy or completeness of the information and shall not be liable for any losses arising from the use of this information. Virtual asset investments carry high risks and are subject to significant price volatility. You may lose all of your invested principal. Please fully understand the relevant risks and make prudent decisions based on your own financial situation and risk tolerance. For details, please refer to
Disclaimer.
Related Articles
Pi Network RPC server startup, supply pressure obstructs a technical rebound for PI
Pi Network announced that its testnet remote procedure call (RPC) servers are now live, laying the groundwork for building a smart contract ecosystem. Although this news is seen as a positive, the core team’s selling of more than 21.8 million PI tokens, along with the ongoing supply pressure stemming from user top-ups, has still exerted downside pressure on the market. Technical analysis shows that the support level for the PI token is $0.1736; the future price action needs to be closely watched.
MarketWhisper33m ago
A whale-led selloff is driving the Bitcoin market, and ETF institutional buy pressure is unable to turn the tide
A CryptoQuant report indicates that as of the end of March, Bitcoin’s “apparent demand” is -63,000 BTC, showing that the market has an oversupply situation, and institutional buying cannot offset retail selling. Starting in mid-2025, the giant whales began large-scale selling, pushing the market into a distribution phase. Although ETF institutional buying has increased, it has not been able to change the weak demand situation, and weakening domestic U.S. demand may further affect the market. Easing geopolitical tensions could become a catalyst for a short-term rebound.
MarketWhisper48m ago
BTC 15-minute drop of 0.73%: Technical support fails and on-chain congestion converges to suppress the rebound
From 2026-04-02 02:00 to 2026-04-02 02:15 (UTC), the BTC price fluctuated within the 66,858.6 - 67,355.0 USDT range. Over the 15 minutes, the return was -0.73%, and the amplitude reached 0.74%. During this period, market attention increased, short-term volatility intensified, and investors’ sentiment clearly shifted toward caution.
The main driving force behind this abnormal move was that the key technical support level of $66,700 was broken, along with the RSI falling below 30, indicating that short-term momentum weakened rapidly and investors’ willingness to sell increased. Additionally, the market sentiment became more cautious, and trading volume showed signs of decline.
GateNews49m ago
The “crypto pullback” wave on April 1: Is it a joke or a warning sign from within the market?
On April 1, at least five influential figures in the cryptocurrency space simultaneously posted farewell messages, declaring that they were leaving the industry permanently.
The posts quickly spread across X, creating a wave of confusion as the community couldn’t clearly tell where the serious statements ended.
TapChiBitcoin1h ago
Bitcoin, stocks soar as markets respond to chance of US and Israel-Iran war ending
Bitcoin (BTC) briefly jumped to $68,589, and US stock markets rallied as investors reacted to US President Donald Trump's statements on considering options for ending the US and Israel-Iran war. Separate, unconfirmed comments attributed to Iranian President Masoud Pezeshkian also suggested that Iran
Cointelegraph1h ago
Gate Daily Report (April 2): The U.S. Department of the Treasury releases a notice of proposed rules for the “GENIUS Act”; the CFTC says it is prepared to regulate the entire crypto market
Bitcoin (BTC) dipped in the short term to $67,600. The U.S. Department of the Treasury launched a small consultation on regulatory guidance for stablecoins under the “GENIUS Act,” and the CFTC Chair said he is ready to regulate the entire crypto market. Amid market developments, spot Bitcoin inflows are slightly higher than outflows, and the CFTC and the SEC have signed an agreement to coordinate digital asset regulation.
MarketWhisper1h ago
