
Key Takeaways
-
Pump.fun (PUMP) has surged over 18% recently, extending its monthly gains to nearly 60%.
-
The daily chart shows a clear inverse head and shoulders pattern, a classic bullish reversal setup.
-
PUMP has reclaimed the 50-day moving average, which is now acting as key short-term support.
-
The $0.003025 neckline resistance is the critical breakout level to watch.
-
A confirmed breakout could target $0.004612, implying a potential 53% upside.
Pump.fun (PUMP), the native token of the popular Solana-based launchpad protocol, is quietly gaining traction in the crypto market. After posting a sharp 18%+ rally, PUMP has now extended its monthly gains to nearly 60%. While the price surge has caught traders’ attention, a closer look at the daily chart structure suggests this move could be part of a larger bullish setup — provided a key resistance level is cleared.
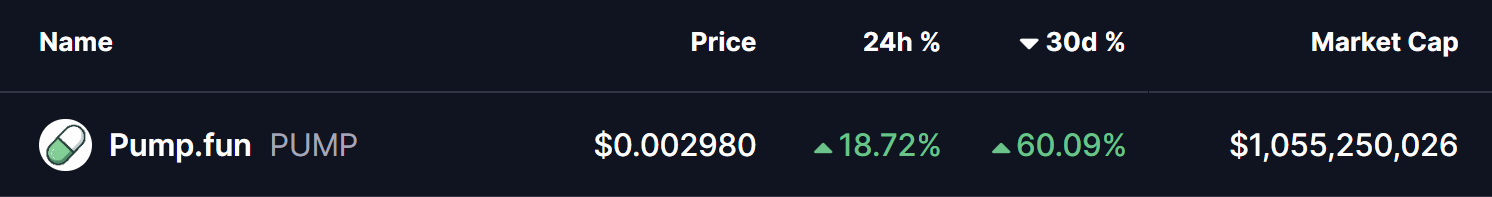
Source: Coinmarketcap
Inverse Head and Shoulders Pattern Takes Shape
On the daily timeframe, PUMP has carved out a well-defined inverse head and shoulders pattern, one of the most widely followed bullish reversal formations in technical analysis.
-
The left shoulder formed in early December near the $0.00247 region.
-
This was followed by a deeper pullback toward $0.00167, creating the head of the structure.
-
Price then recovered and found support again near $0.00225, completing the right shoulder.
Following the formation of this structure, PUMP rebounded steadily and has successfully reclaimed the 50-day moving average, which is now acting as dynamic support. The token is currently consolidating just below the neckline resistance around $0.003025, a level clearly highlighted on the chart.
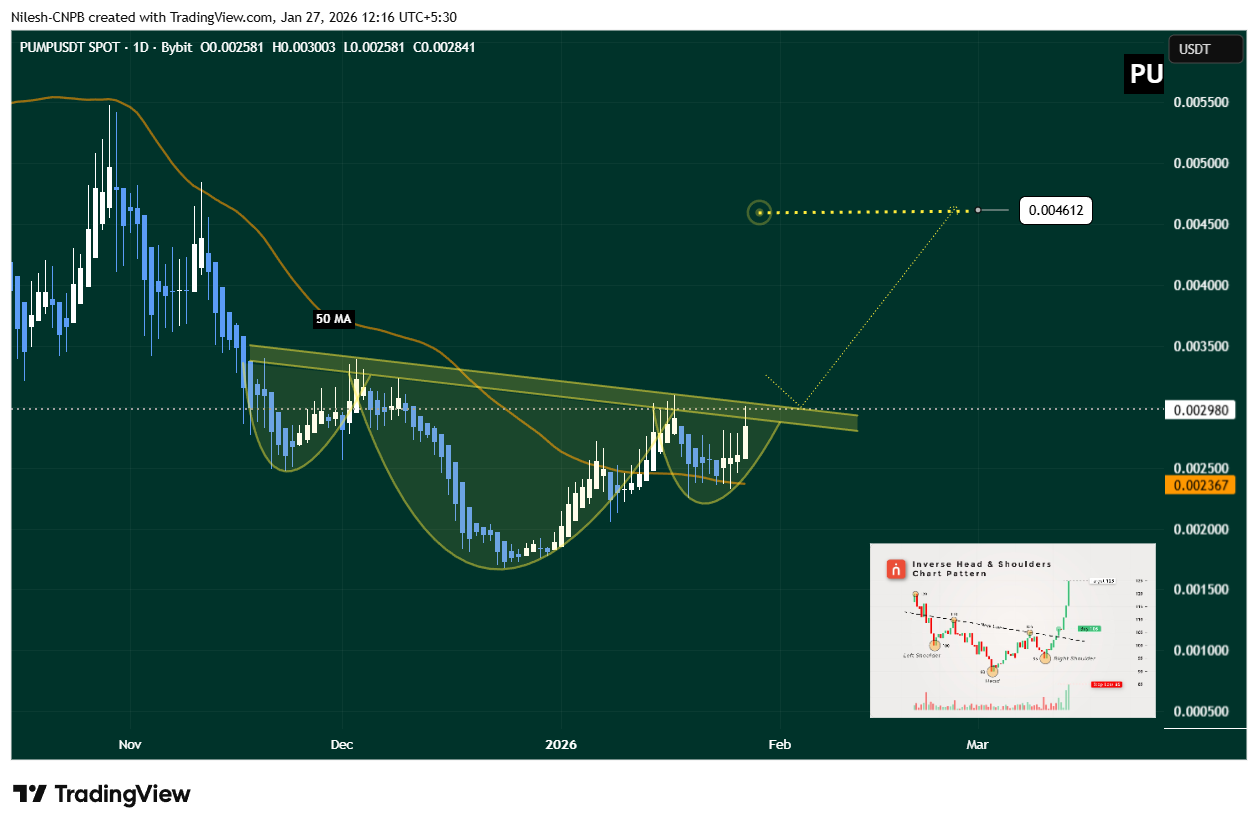
Pump.fun (PUMP) Daily Chart/Coinsprobe (Source: Tradingview)
This tightening price action near resistance often precedes a volatility expansion, suggesting a decisive move could be approaching.
What’s Next for PUMP?
For bullish momentum to gain confirmation, PUMP needs a strong daily close above the $0.003025 neckline, ideally followed by a successful retest of this zone as support. Such a move would validate the inverse head and shoulders breakout and signal a shift in short-term market structure.
Based on the measured move from the inverse head and shoulders pattern, a confirmed breakout could open the door for a price target near $0.004612 — representing a potential 53% upside from the breakout zone.
On the downside, failure to clear the neckline could lead to further consolidation. In that scenario, holding above the 50-day moving average and the $0.002367 support zone will be critical to keep the broader bullish setup intact.
Bottom Line
PUMP’s recent rally appears to be supported by a constructive chart pattern and improving momentum. As long as price continues to coil beneath neckline resistance while holding key support levels, the probability of a breakout remains elevated.
A decisive move above $0.003025 could mark the start of a fresh upside leg, while rejection would likely extend the current consolidation.
Disclaimer: The views and analysis presented in this article are for informational purposes only and reflect the author’s perspective, not financial advice. Technical patterns and indicators discussed are subject to market volatility and may or may not yield the anticipated results. Investors are advised to exercise caution, conduct independent research, and make decisions aligned with their individual risk tolerance.
About Author: Nilesh Hembade is the Founder and Lead Author of Coinsprobe, with over 5 years of experience in the cryptocurrency and blockchain industry. Since launching Coinsprobe in 2023, he has been providing daily, research-driven insights through in-depth market analysis, on-chain data, and technical research.
Disclaimer: The information on this page may come from third parties and does not represent the views or opinions of Gate. The content displayed on this page is for reference only and does not constitute any financial, investment, or legal advice. Gate does not guarantee the accuracy or completeness of the information and shall not be liable for any losses arising from the use of this information. Virtual asset investments carry high risks and are subject to significant price volatility. You may lose all of your invested principal. Please fully understand the relevant risks and make prudent decisions based on your own financial situation and risk tolerance. For details, please refer to
Disclaimer.
Related Articles
Gold’s longest losing streak in a century meets bitcoin’s resurgence
Gold is facing its longest losing streak in over a century, dropping 27% from its January peak, but recently rebounded slightly. Meanwhile, Bitcoin has outperformed, with significant inflows into Bitcoin ETFs, while gold ETFs see outflows.
CoinDesk19m ago
'Use the Chain, Make Cardano Better': Charles Hoskinson Says - U.Today
Charles Hoskinson, founder of Cardano, urges the community to actively engage with the platform and use its blockchain for transactions and development. This participation can enhance ADA's adoption despite recent price volatility. Cardano's DeFi has hit 520 million ADA in Total Value Locked, with aspirations reaching one billion.
UToday31m ago
Bhutan's Bitcoin Holdings Plunge to 4,453 BTC, Sovereign Nation Accelerates Selloff
Bhutan's Royal Government recently transferred 519.7 BTC, valued at approximately $37.75 million, reducing its holdings to approximately 4,453 BTC. The accelerated Bitcoin transfers demonstrate continuous adjustments to sovereign holdings, which may impact market price volatility. Investors should monitor this development.
GateNews36m ago
XRP ETF Accumulated Net Outflows of ~30.12 Million USD in March, 16% Price Pullback Risk Emerging
XRP is currently trading near $1.42, down 8% recently. Technical charts show the formation of a head and shoulders pattern. If the neckline breaks, it could decline to $1.15. ETF outflows and on-chain data indicate weakening market confidence, suggesting further selling pressure. Key support is at $1.37; a break below could trigger panic selling. To reverse the bearish trend, a close above $1.46 is needed. Investors should monitor support levels and capital flows.
GateNews40m ago
Fidelity Clients Panic-Dump $50M Bitcoin ETF!
The recent outflows from Fidelity Investments highlight a shift in short-term investor behavior within the crypto market. In the United States, Bitcoin ETFs recorded net outflows of approximately $66 million during the same period, signaling a phase of adjustment rather than a major trend
Coinfomania43m ago
Iran's high ceasefire conditions trigger market volatility, with Bitcoin rebounding to $71,300
Iran has proposed ceasefire conditions, including reparations and control of the Strait of Hormuz, but the United States considers them unrealistic. The US military buildup has heightened Iran's skepticism about peace negotiations, causing oil prices to soar and impacting commodities markets. Gold and Bitcoin have also experienced increased volatility, as global investors pay close attention to the development of the situation.
GateNews45m ago
