
Key Takeaways
-
Ethereum ($ETH) has broken below the critical $2,637 support, signaling a shift in short-term market structure.
-
Price is now trading near $2,400, posting an 11.10% daily loss and a 18% year-to-date decline.
-
The current price action mirrors a bearish fractal from August 2024, raising the risk of further downside.
-
If selling pressure persists, ETH could slide toward the $2,128 support zone, where buyers may attempt a defense.
Ethereum ($ETH), the second-largest cryptocurrency by market capitalization, is once again under heavy selling pressure. As of January 31, 2026, ETH has slipped near the $2,400 mark, printing an 11.10% decline in the last 24 hours and extending its year-to-date losses to 18.73%, while also marking a fresh yearly low.
The sharp move lower has shifted short-term sentiment firmly in favor of the bears, with both price structure and derivatives data flashing warning signs.
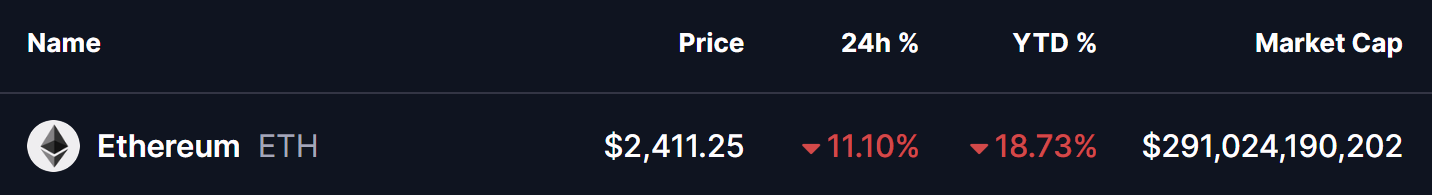
Source: Coinmarketcap
Liquidations Soar as Bulls Get Trapped
The downside move has been amplified by aggressive liquidations across the derivatives market. Recent data shows over $553 million worth of ETH positions liquidated, with a striking $523 million coming from long positions, compared to just $30 million in shorts over the past 24 hours.
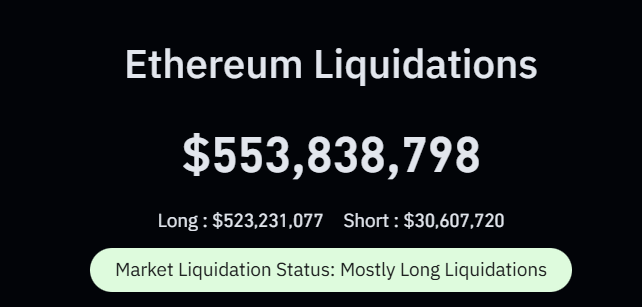
Ethereum (ETH) Liquidations/Source: Coinglass
This imbalance highlights a classic scenario of over-leveraged bulls getting flushed out, where forced sell orders accelerate downside momentum. When liquidations skew this heavily toward longs, price often struggles to find immediate relief, as dip buyers hesitate and momentum traders press their advantage.
Bears Take Control on the Daily Chart
From a technical perspective, Ethereum’s daily chart paints a concerning picture. ETH has decisively lost the $2,637 horizontal support, a level that previously acted as a floor during consolidation. Once this zone gave way, selling pressure intensified, dragging price swiftly toward the $2,400 region.
What makes this move particularly notable is its resemblance to a previous downside fractal visible on the chart. Back in August 2024, ETH broke a similar support structure, triggering a sharp continuation move that ultimately drove price into a deeper corrective phase before buyers finally stepped in.
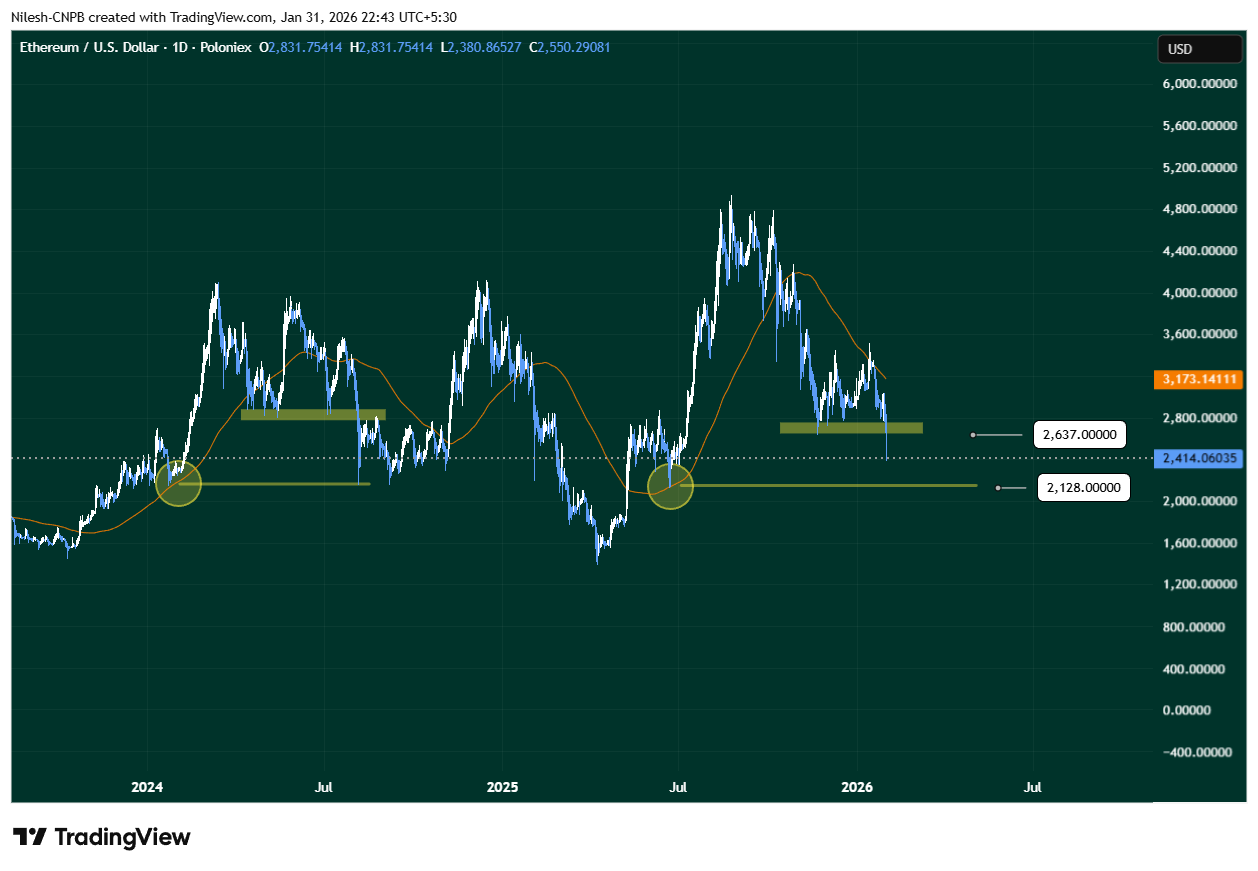
Ethereum (ETH) Daily Chart/Coinsprobe (Source: Tradingview)
The current structure appears to be echoing that same behavior—support break, rapid downside expansion, and limited bounce attempts so far.
More Pain Ahead?
If this historical fractal continues to play out, Ethereum could be heading toward its next major support near $2,128, a zone that previously attracted strong demand. This level stands out as a potential area where longer-term buyers may begin to show interest, especially if broader market conditions stabilize.
On a flip side, a strong reclaim of the $2,637 resistance zone, followed by acceptance above it, would invalidate the current fractal setup and suggest that today’s breakdown was a false move. Such a recovery would likely force late shorts to cover and could stabilize price action.
For now, however, Ethereum remains vulnerable. With heavy long liquidations, broken support, and a familiar bearish pattern resurfacing on the chart, the path of least resistance appears tilted to the downside—at least in the short term.
Disclaimer: The views and analysis presented in this article are for informational purposes only and reflect the author’s perspective, not financial advice. Technical patterns and indicators discussed are subject to market volatility and may or may not yield the anticipated results. Investors are advised to exercise caution, conduct independent research, and make decisions aligned with their individual risk tolerance.
About Author: Nilesh Hembade is the Founder and Lead Author of Coinsprobe, with over 5 years of experience in the cryptocurrency and blockchain industry. Since launching Coinsprobe in 2023, he has been providing daily, research-driven insights through in-depth market analysis, on-chain data, and technical research.
Disclaimer: The information on this page may come from third parties and does not represent the views or opinions of Gate. The content displayed on this page is for reference only and does not constitute any financial, investment, or legal advice. Gate does not guarantee the accuracy or completeness of the information and shall not be liable for any losses arising from the use of this information. Virtual asset investments carry high risks and are subject to significant price volatility. You may lose all of your invested principal. Please fully understand the relevant risks and make prudent decisions based on your own financial situation and risk tolerance. For details, please refer to
Disclaimer.
Related Articles
Japan’s Gen Z fears crypto scams the most: young people are more vigilant, yet investment decisions are still dominated by YouTube personalities
The latest research shows that Japan’s Gen Z has stronger risk-awareness in the cryptocurrency space, especially staying alert to scams on social media. Overall data indicates the main concerns include understanding how cryptocurrencies work, price volatility, and scam risk. Older groups focus more on technical complexity, while Millennials are the most active investors. About 50% of respondents have not been exposed to cryptocurrencies, and their information mainly comes from traditional news and social media, with YouTube having the greatest impact on decision-making. In the future, targeted education will be needed to increase user engagement.
GateNews3m ago
Over the past 24 hours, the entire market was liquidated across the web to the tune of $248 million, with long liquidations totaling approximately $125 million.
Gate News update: On April 3, according to CoinAnk data, over the past 24 hours, liquidations across the entire market totaled $248 million, including approximately $125 million liquidated from long positions and approximately $123 million liquidated from short positions. By coin, Bitcoin liquidations were about $48.13 million, and Ethereum liquidations were about $28.34 million.
GateNews1h ago
Ethereum stablecoin market share fell from 90% to 65%, while the number of independent senders rose to 12,000
Based on the latest data, Ethereum’s market share in non-USD stablecoins has fallen from 90% in 2023 to 65% as of February 2026, while other blockchains have rapidly risen. Despite this, Ethereum still remains the primary stablecoin issuing chain, and the number of unique senders has increased significantly.
GateNews1h ago
Cardano Outshines Ethereum in Google’s Quantum AI Whitepaper Rankings
Cardano ranks above Ethereum in Google Quantum AI quantum resistance report.
Ethereum faces major risks from exposed wallets and vulnerable smart contracts.
Cardano’s UTXO design offers stronger protection against future quantum attacks.
A recent Google Quantum AI whitepaper sparked
CryptoNewsLand2h ago
