
Key Takeaways
-
ASTER rebounds strongly, gaining nearly 10% as the broader crypto market recovers, with price holding above key support near $0.55.
-
Harmonic structure remains bullish in the short term, with the Bearish Shark pattern allowing upside continuation toward resistance.
-
A breakout above $0.687 (50-day MA) could open the path toward the $0.828 target, while failure to hold support may invalidate the setup.
The broader cryptocurrency market is showing signs of relief today after a sharp sell-off earlier this week. Bitcoin (BTC) briefly dipped to the $74,000 region before staging a rebound above $78,000, gaining nearly 3% on the day. Ethereum (ETH) has also followed suit, climbing around 4.4% in the past 24 hours.
Amid this recovery, several altcoins have turned green, including the decentralized exchange (DEX) token Aster (ASTER). The token has surged over 8%, trimming its monthly losses to around 21%. More importantly, ASTER’s price action is now flashing a familiar technical setup that hints at further upside potential.
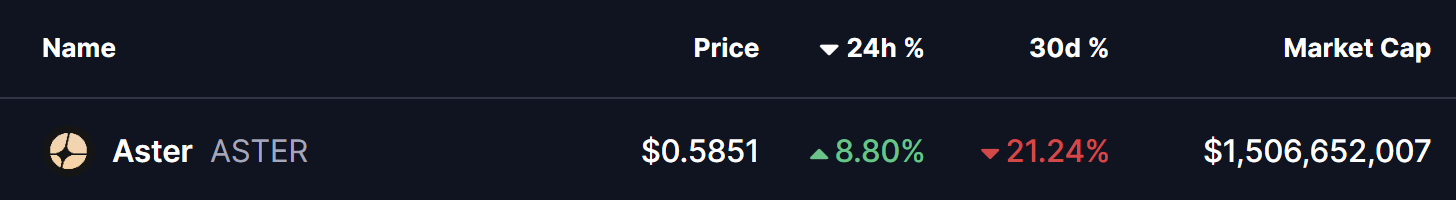
Source: Coinmarketcap
Technical Patterns Hint at Upside Momentum
From a technical perspective, ASTER’s daily chart reveals the formation of a Bearish Shark harmonic pattern, a widely tracked structure in harmonic trading. While the pattern is traditionally associated with a possible reversal once fully completed, it often allows for short-term bullish continuation as price advances toward the C-point.
As seen on the chart, the O-X-A-B structure has already been completed, with price finding support near the B-point around the $0.55 region. ASTER is currently trading near $0.584, showing early signs of stabilization after the recent sell-off.
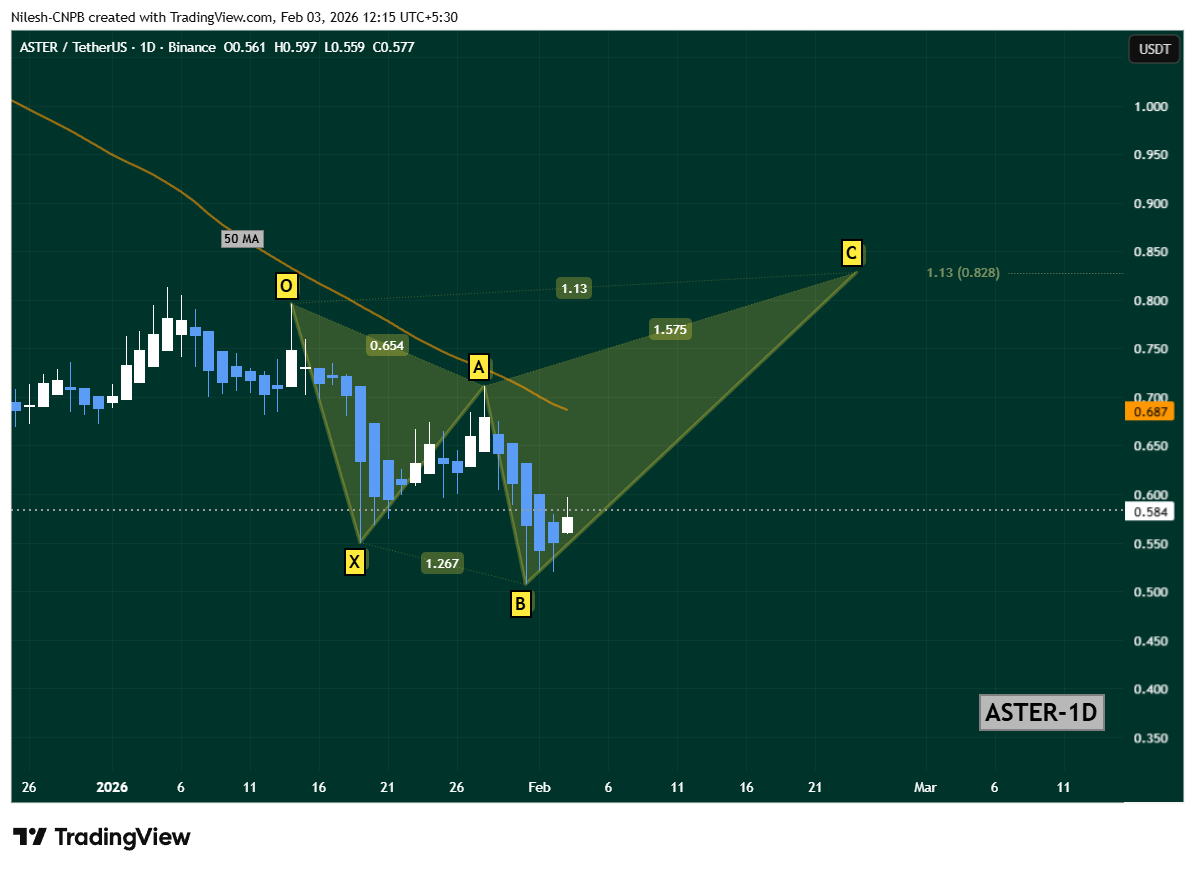
Aster (ASTER) Daily Chart/Coinsprobe (Source: Tradingview
The immediate hurdle for bulls remains the 50-day moving average, positioned around $0.687. This level has acted as a dynamic resistance in recent weeks, capping upside attempts and triggering pullbacks.
What’s Next for ASTER?
A decisive daily close above the 50-day MA ($0.687) would be a key technical signal, strengthening the short-term recovery narrative. Such a breakout could attract fresh momentum buyers and set the stage for a broader upside move.
If bullish momentum sustains, the harmonic projection points toward the C-point near $0.828, which aligns with the 1.13 Fibonacci extension of the Shark pattern. This level represents a potential upside target in the coming sessions, provided overall market sentiment remains supportive.
Despite the improving technical picture, downside risks have not disappeared. A failure to hold the B-point support zone could invalidate the bullish continuation scenario. In that case, ASTER may enter a period of extended consolidation or face renewed downside pressure before any meaningful recovery attempt.
Disclaimer: The views and analysis presented in this article are for informational purposes only and reflect the author’s perspective, not financial advice. Technical patterns and indicators discussed are subject to market volatility and may or may not yield the anticipated results. Investors are advised to exercise caution, conduct independent research, and make decisions aligned with their individual risk tolerance.
About Author: Nilesh Hembade is the Founder and Lead Author of Coinsprobe, with over 5 years of experience in the cryptocurrency and blockchain industry. Since launching Coinsprobe in 2023, he has been providing daily, research-driven insights through in-depth market analysis, on-chain data, and technical research.
Disclaimer: The information on this page may come from third parties and does not represent the views or opinions of Gate. The content displayed on this page is for reference only and does not constitute any financial, investment, or legal advice. Gate does not guarantee the accuracy or completeness of the information and shall not be liable for any losses arising from the use of this information. Virtual asset investments carry high risks and are subject to significant price volatility. You may lose all of your invested principal. Please fully understand the relevant risks and make prudent decisions based on your own financial situation and risk tolerance. For details, please refer to
Disclaimer.
Related Articles
Pi Network RPC server startup, supply pressure obstructs a technical rebound for PI
Pi Network announced that its testnet remote procedure call (RPC) servers are now live, laying the groundwork for building a smart contract ecosystem. Although this news is seen as a positive, the core team’s selling of more than 21.8 million PI tokens, along with the ongoing supply pressure stemming from user top-ups, has still exerted downside pressure on the market. Technical analysis shows that the support level for the PI token is $0.1736; the future price action needs to be closely watched.
MarketWhisper4m ago
A whale-led selloff is driving the Bitcoin market, and ETF institutional buy pressure is unable to turn the tide
A CryptoQuant report indicates that as of the end of March, Bitcoin’s “apparent demand” is -63,000 BTC, showing that the market has an oversupply situation, and institutional buying cannot offset retail selling. Starting in mid-2025, the giant whales began large-scale selling, pushing the market into a distribution phase. Although ETF institutional buying has increased, it has not been able to change the weak demand situation, and weakening domestic U.S. demand may further affect the market. Easing geopolitical tensions could become a catalyst for a short-term rebound.
MarketWhisper20m ago
BTC 15-minute drop of 0.73%: Technical support fails and on-chain congestion converges to suppress the rebound
From 2026-04-02 02:00 to 2026-04-02 02:15 (UTC), the BTC price fluctuated within the 66,858.6 - 67,355.0 USDT range. Over the 15 minutes, the return was -0.73%, and the amplitude reached 0.74%. During this period, market attention increased, short-term volatility intensified, and investors’ sentiment clearly shifted toward caution.
The main driving force behind this abnormal move was that the key technical support level of $66,700 was broken, along with the RSI falling below 30, indicating that short-term momentum weakened rapidly and investors’ willingness to sell increased. Additionally, the market sentiment became more cautious, and trading volume showed signs of decline.
GateNews20m ago
The “crypto pullback” wave on April 1: Is it a joke or a warning sign from within the market?
On April 1, at least five influential figures in the cryptocurrency space simultaneously posted farewell messages, declaring that they were leaving the industry permanently.
The posts quickly spread across X, creating a wave of confusion as the community couldn’t clearly tell where the serious statements ended.
TapChiBitcoin35m ago
Bitcoin, stocks soar as markets respond to chance of US and Israel-Iran war ending
Bitcoin (BTC) briefly jumped to $68,589, and US stock markets rallied as investors reacted to US President Donald Trump's statements on considering options for ending the US and Israel-Iran war. Separate, unconfirmed comments attributed to Iranian President Masoud Pezeshkian also suggested that Iran
Cointelegraph1h ago
Gate Daily Report (April 2): The U.S. Department of the Treasury releases a notice of proposed rules for the “GENIUS Act”; the CFTC says it is prepared to regulate the entire crypto market
Bitcoin (BTC) dipped in the short term to $67,600. The U.S. Department of the Treasury launched a small consultation on regulatory guidance for stablecoins under the “GENIUS Act,” and the CFTC Chair said he is ready to regulate the entire crypto market. Amid market developments, spot Bitcoin inflows are slightly higher than outflows, and the CFTC and the SEC have signed an agreement to coordinate digital asset regulation.
MarketWhisper1h ago
