
Key Takeaways
-
Pump.fun (PUMP) has surged over 18% recently, extending its monthly gains to nearly 60%.
-
The daily chart shows a clear inverse head and shoulders pattern, a classic bullish reversal setup.
-
PUMP has reclaimed the 50-day moving average, which is now acting as key short-term support.
-
The $0.003025 neckline resistance is the critical breakout level to watch.
-
A confirmed breakout could target $0.004612, implying a potential 53% upside.
Pump.fun (PUMP), the native token of the popular Solana-based launchpad protocol, is quietly gaining traction in the crypto market. After posting a sharp 18%+ rally, PUMP has now extended its monthly gains to nearly 60%. While the price surge has caught traders’ attention, a closer look at the daily chart structure suggests this move could be part of a larger bullish setup — provided a key resistance level is cleared.
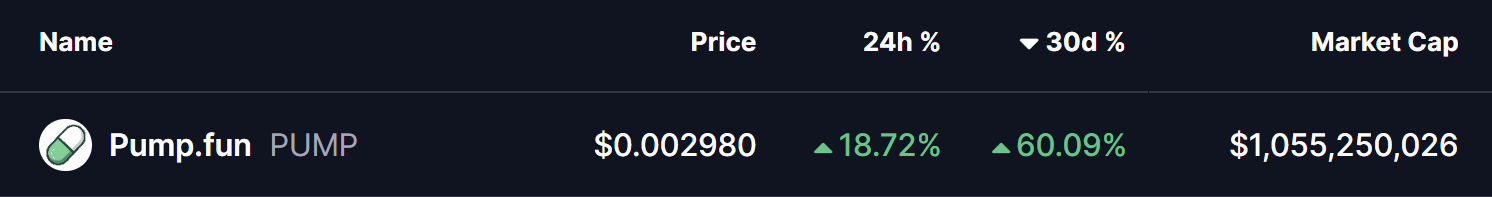
Source: Coinmarketcap
Inverse Head and Shoulders Pattern Takes Shape
On the daily timeframe, PUMP has carved out a well-defined inverse head and shoulders pattern, one of the most widely followed bullish reversal formations in technical analysis.
-
The left shoulder formed in early December near the $0.00247 region.
-
This was followed by a deeper pullback toward $0.00167, creating the head of the structure.
-
Price then recovered and found support again near $0.00225, completing the right shoulder.
Following the formation of this structure, PUMP rebounded steadily and has successfully reclaimed the 50-day moving average, which is now acting as dynamic support. The token is currently consolidating just below the neckline resistance around $0.003025, a level clearly highlighted on the chart.
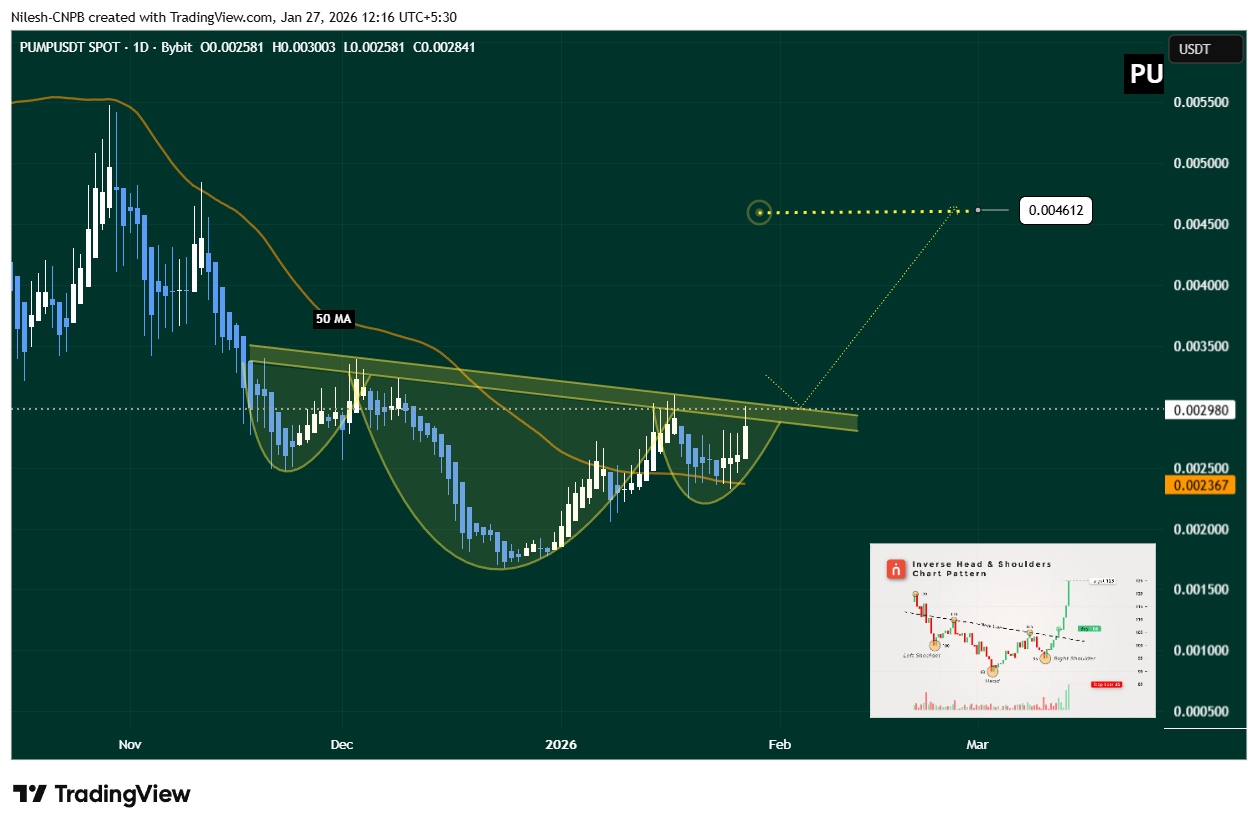
Pump.fun (PUMP) Daily Chart/Coinsprobe (Source: Tradingview)
This tightening price action near resistance often precedes a volatility expansion, suggesting a decisive move could be approaching.
What’s Next for PUMP?
For bullish momentum to gain confirmation, PUMP needs a strong daily close above the $0.003025 neckline, ideally followed by a successful retest of this zone as support. Such a move would validate the inverse head and shoulders breakout and signal a shift in short-term market structure.
Based on the measured move from the inverse head and shoulders pattern, a confirmed breakout could open the door for a price target near $0.004612 — representing a potential 53% upside from the breakout zone.
On the downside, failure to clear the neckline could lead to further consolidation. In that scenario, holding above the 50-day moving average and the $0.002367 support zone will be critical to keep the broader bullish setup intact.
Bottom Line
PUMP’s recent rally appears to be supported by a constructive chart pattern and improving momentum. As long as price continues to coil beneath neckline resistance while holding key support levels, the probability of a breakout remains elevated.
A decisive move above $0.003025 could mark the start of a fresh upside leg, while rejection would likely extend the current consolidation.
Disclaimer: The views and analysis presented in this article are for informational purposes only and reflect the author’s perspective, not financial advice. Technical patterns and indicators discussed are subject to market volatility and may or may not yield the anticipated results. Investors are advised to exercise caution, conduct independent research, and make decisions aligned with their individual risk tolerance.
About Author: Nilesh Hembade is the Founder and Lead Author of Coinsprobe, with over 5 years of experience in the cryptocurrency and blockchain industry. Since launching Coinsprobe in 2023, he has been providing daily, research-driven insights through in-depth market analysis, on-chain data, and technical research.
Disclaimer: The information on this page may come from third parties and does not represent the views or opinions of Gate. The content displayed on this page is for reference only and does not constitute any financial, investment, or legal advice. Gate does not guarantee the accuracy or completeness of the information and shall not be liable for any losses arising from the use of this information. Virtual asset investments carry high risks and are subject to significant price volatility. You may lose all of your invested principal. Please fully understand the relevant risks and make prudent decisions based on your own financial situation and risk tolerance. For details, please refer to
Disclaimer.
Related Articles
Bitcoin Price Surges 10% Then Falls Into Bull Trap? Exchange Inflows Spike Draws Attention
Bitcoin price fluctuates at $70,700, with a monthly gain of approximately 10%. Both retail investors and whales are simultaneously accumulating Bitcoin, with capital inflows surging, yet this may bring selling pressure. The derivatives market shows bullish sentiment, but spot selling pressure could trigger forced liquidations. The key technical support level is at $70,700, and market dynamics require close monitoring.
GateNews1m ago
XRP Struggles Below $1.60 Despite Record Retail Holders
XRP has 5.66 million retail holders, showing strong accumulation at lower price levels.
Whale activity turned positive in March, contributing to market stability and a 21% rally.
Price stalls at $1.60 resistance; broader market conditions will determine the next breakout.
Ripple’s XRP ha
CryptoNewsLand1m ago
The bear market is causing another structural breakdown: What will happen next with WLD?
Worldcoin (WLD) experienced an impressive price rise on March 23, recovering 8.46% from a daily low. However, it struggled to maintain momentum after reaching $0.3296 and slipped back to around $0.3175, raising concerns about its future trend amidst a longer-term downtrend.
TapChiBitcoin3m ago
Stellar News: XLM Price Rises 14% Faces Resistance, Breakthrough of $0.1776 Could Trigger New Rally
Stellar (XLM) has risen 14% recently, approaching the Fibonacci resistance level of $0.1776, with buying pressure recovering. If it breaks through this resistance, it could advance toward $0.2010; if rejected, it may trigger liquidations. Watch key resistance levels and downside risks.
GateNews15m ago
Ethereum Whale Accumulation Ignites Rally Momentum, Is ETH About to Break Through $2400?
Due to continued accumulation by whales and tight market supply, Ethereum has formed support around $2100, with recent price rebounds to $2170, and is expected to potentially break through $2400 in the future. Network upgrades and quantum security technology enhancements boost investor confidence, with comprehensive bullish factors increasing.
GateNews17m ago
Why Did the Crypto Market Fall Today? US-Iran War Dampens Demand for Speculative Assets, Bitcoin and Altcoins Under Pressure
As of March 25, the cryptocurrency market capitalization was approximately $2.4 trillion, with overall stagnation. The US-Iran conflict elevated risk-averse sentiment, with Bitcoin price maintaining around $70,644. Ireland and Europol seized 500 Bitcoin. Technical analysis shows Bitcoin may face short-term pullback, with Decred also under downward pressure, as the market exhibits volatile trading.
GateNews21m ago
