
Ethereum network activity reaches 1.1 million transactions, hitting a new high, but history warns of risks. After the 2018 ICO peak, it dropped from 1,400 to 100; following the 2021 DeFi boom, it fell from 4,000 to 2,000. Exchange inflow surged to 1.3 million on February 3rd, setting a new high, but two days later, it dropped below 2,100 from 2,230. CryptoQuant states that the market is in a high-risk zone.
Dual Perspectives on the 1.1 Million Transaction High
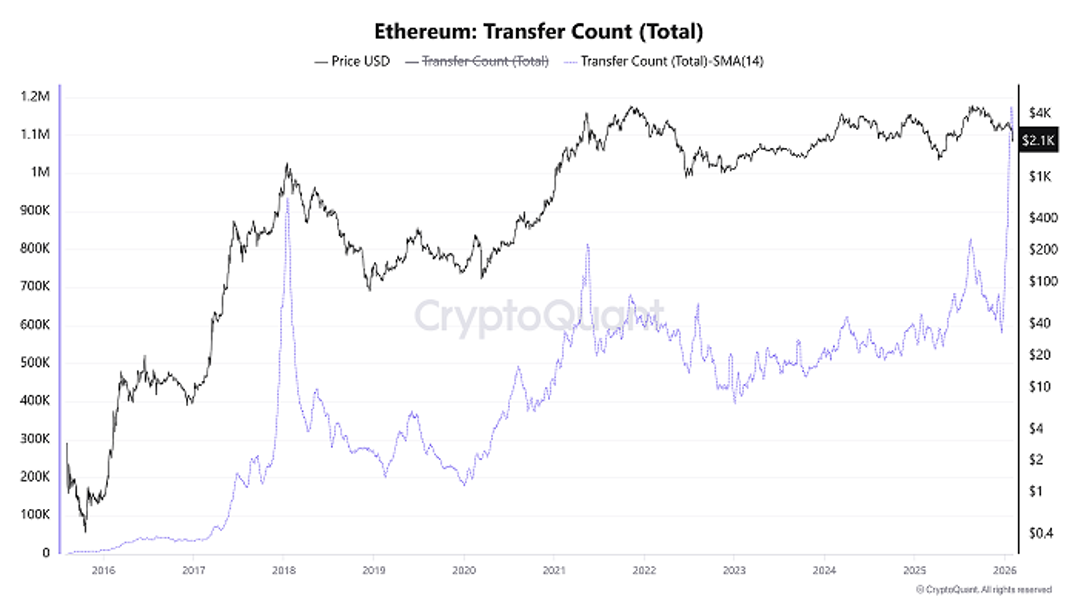
(Source: CryptoQuant)
In February, CryptoQuant data shows that Ethereum network activity, measured by the 14-day moving average of transfer counts (total token transfers), reached a record 1.1 million. At first glance, this number seems promising. It indicates strong growth in the Ethereum network and expanding application scope. Increased network activity is often seen as a sign of ecosystem prosperity, suggesting more users are engaging in transactions, deploying smart contracts, or participating in DeFi and NFT activities.
However, deeper analysis suggests this may not be the bullish signal many expect. Instead, based on historical precedents, it could indicate that prices are entering a correction phase or even cyclical peaks. CryptoQuant analyst CryptoOnchain points out that two periods of abnormally high Ethereum network activity have historically signaled market tops.
On January 18, 2018, at the peak of the ICO craze, network activity surged. Shortly after, ETH price plummeted from about $1,400 to below $100 by year’s end, a decline of over 92%. This drop dragged the entire crypto market into a two-year “crypto winter.” On May 19, 2021, amid explosive growth in DeFi and NFTs, this indicator hit a new high again. The market then sharply reversed, with ETH falling from over $4,000 to below $2,000, a decline of over 50%.
The reason is simple. An increase in ETH transfer volume often indicates that more investors are withdrawing funds from wallets, frequently involving large transactions. This behavior may reflect investors attempting to sell in anticipation of worsening conditions. When network activity increases due to active buying and position-building, it is a genuine bullish signal. But when activity rises because users are transferring tokens from cold wallets to exchanges in preparation to sell, it signals accumulating selling pressure.
Lessons from the History of Ethereum Network Activity Peaks
January 18, 2018: ICO bubble peak, followed by a drop from 1,400 to 100 (92% decline)
May 19, 2021: DeFi/NFT explosion, followed by a drop from 4,000 to 2,000 (50% decline)
Early February 2026: Transfer count hits a new high of 1.1 million, with current price already below 2,100 from 2,230
CryptoOnchain states: “The current situation is very similar to 2018 and 2021. Although macro conditions have changed, on-chain behavior of network participants indicates we are in a high-risk zone.” This judgment is based on pattern recognition rather than fundamental analysis, serving as a reminder for investors not to be blindly optimistic just because network activity increases.
Exchange Inflows of 1.3 Million as a Sell Signal
In early February, when ETH fell below $2,300, another indicator of Ethereum network activity—the inflow volume to exchanges (top 10)—spiked, further supporting this view. The Ethereum exchange inflow (top ten largest inflows) measures the total tokens transferred in the ten largest deposit transactions to exchanges. Higher values indicate that investors are depositing large amounts of funds at once. This usually signals rising selling pressure and increased risk of further price declines.
On February 3rd, this indicator surged to 1.3 million, a new high in a year. Two days later, ETH price dropped from $2,230 to below $2,100, roughly a 6% decline. This “influx spike → price plunge” sequence clearly demonstrates the leading nature of this indicator. When large amounts of ETH flood into exchanges in a short period, the primary purpose is almost certainly to sell.
A 1.3 million inflow is an extreme figure in the Ethereum market—equivalent to about $260 million at that time. If all were sold into the market, it could quickly push prices down several percentage points. More importantly, this metric tracks the “top ten” largest inflows, indicating activity by whales or institutions rather than retail investors. Large-scale sell-offs by big players tend to be more planned and sustained, exerting longer-lasting impact on prices.
Psychologically, when investors decide to transfer large amounts of ETH from personal wallets to exchanges, it often signifies a loss of confidence in the short-term outlook. Holding ETH in personal wallets suggests a long-term holding intent, while transferring to exchanges indicates readiness to liquidate. This collective behavioral shift is a clear signal that market sentiment is turning from optimistic to pessimistic.
Similarities and Differences with 2018 and 2021
According to BeInCrypto, confirming a trend reversal requires ETH to rebound to at least $3,000. In the short term, due to ongoing selling pressure, ETH may continue to decline toward the $2,000 support level. This assessment combines technical analysis and on-chain data, with $3,000 serving as a key mid-term threshold; a break above would confirm the end of the bear market.
The current situation resembles 2018 and 2021 in that network activity has reached extreme levels, exchange inflows have surged, and prices have already begun to decline. But there are differences. In 2018, the crash was driven by the ICO bubble burst, regulatory crackdowns, and exposure of scams, leading to a confidence collapse. In 2021, it was a speculative bubble fueled by DeFi and NFTs, with leverage and overheated markets causing sharp corrections. What about now? It may be a combined effect of institutional risk reduction and macro liquidity tightening, rather than issues within the Ethereum ecosystem itself.
This difference suggests that the current correction might differ in nature from previous ones. The 2018 plunge was a fundamental collapse, proving ICO models unsustainable. The 2021 adjustment was a valuation correction, bursting a bubble. If macro factors primarily drive the current decline—such as a rate cut in the US or geopolitical easing—ETH could rebound quickly. But if issues within the Ethereum ecosystem (like severe Layer2 fragmentation or market share erosion by competitors) emerge, it could enter a prolonged downturn.
Recent acknowledgment by Vitalik of Layer2 strategy failures and shifting focus to Layer1 scaling indicates that Ethereum faces strategic challenges. This internal strategic uncertainty, combined with external macro pressures, makes the current network activity peak more of a warning signal than an opportunity.
For investors, a rational approach is: don’t assume Ethereum is thriving just because network activity hits a high. Pay close attention to the motives behind these activities. If they reflect genuine user growth and application expansion, that’s positive. But if they indicate large holders preparing to sell, that’s negative. The current on-chain data leans more toward the latter.
