
Bitcoin drops below $60,000 and then rebounds to $69,800, with selling pressure comparable to the FTX collapse in 2022. Whales have net sold 81,068 BTC in 8 days, with Binance deposits accounting for 48.5%, and the exchange whale ratio soaring to 0.447, hitting a new high. Realized losses have reached $889 million, and ETFs have lost over $6 billion in four months.
The Huge Gap Between Social Media Rumors and Actual Data
As Bitcoin’s price rapidly declines, social media has become a gathering place for speculators, with various theories and price swings happening at nearly the same speed. Traders on X have offered multiple explanations, including rumors of hedge fund liquidations in Hong Kong, yen funding pressures, and even quantum security concerns. However, all these claims share a common problem: they are difficult to verify in real time, and there is no publicly documented evidence to independently explain the scale and timing of these movements.
This doesn’t mean all rumors are false, but such patterns are common in fast-changing markets. A severe liquidation event creates a vacuum of information, and the internet tends to fill this void, often before people can clearly assess the fundamental drivers. The quantum threat theory is especially absurd, as even if Google’s Willow chips achieve quantum advantage, it’s still decades away from cracking Bitcoin encryption. Rumors of hedge fund liquidations in Hong Kong also lack verifiable evidence; no institutions have announced significant losses or closures.
CryptoSlate’s more sustained explanation over the past 24 hours points to observable channels: ETF outflows, forced leverage liquidations, and on-chain data showing Bitcoin whales transferring tokens to exchanges. While less dramatic than a single unexpected catalyst, this explanation aligns more closely with the real mechanism of crypto sell-offs once they start. Although data-based and lacking storytelling appeal, it better reflects market dynamics.
The proliferation of rumors reflects market participants’ desire for simple narratives. Human brains are naturally inclined to seek causality; when complex market events occur, we instinctively want to identify a single “culprit.” But reality is often more mundane: Bitcoin’s plunge isn’t caused by a single dramatic event but results from a confluence of factors like ETF outflows, leverage liquidations, whale deposits, and macro risk aversion.
81,068 BTC Disappeared: Record Whale Selloff in 8 Days
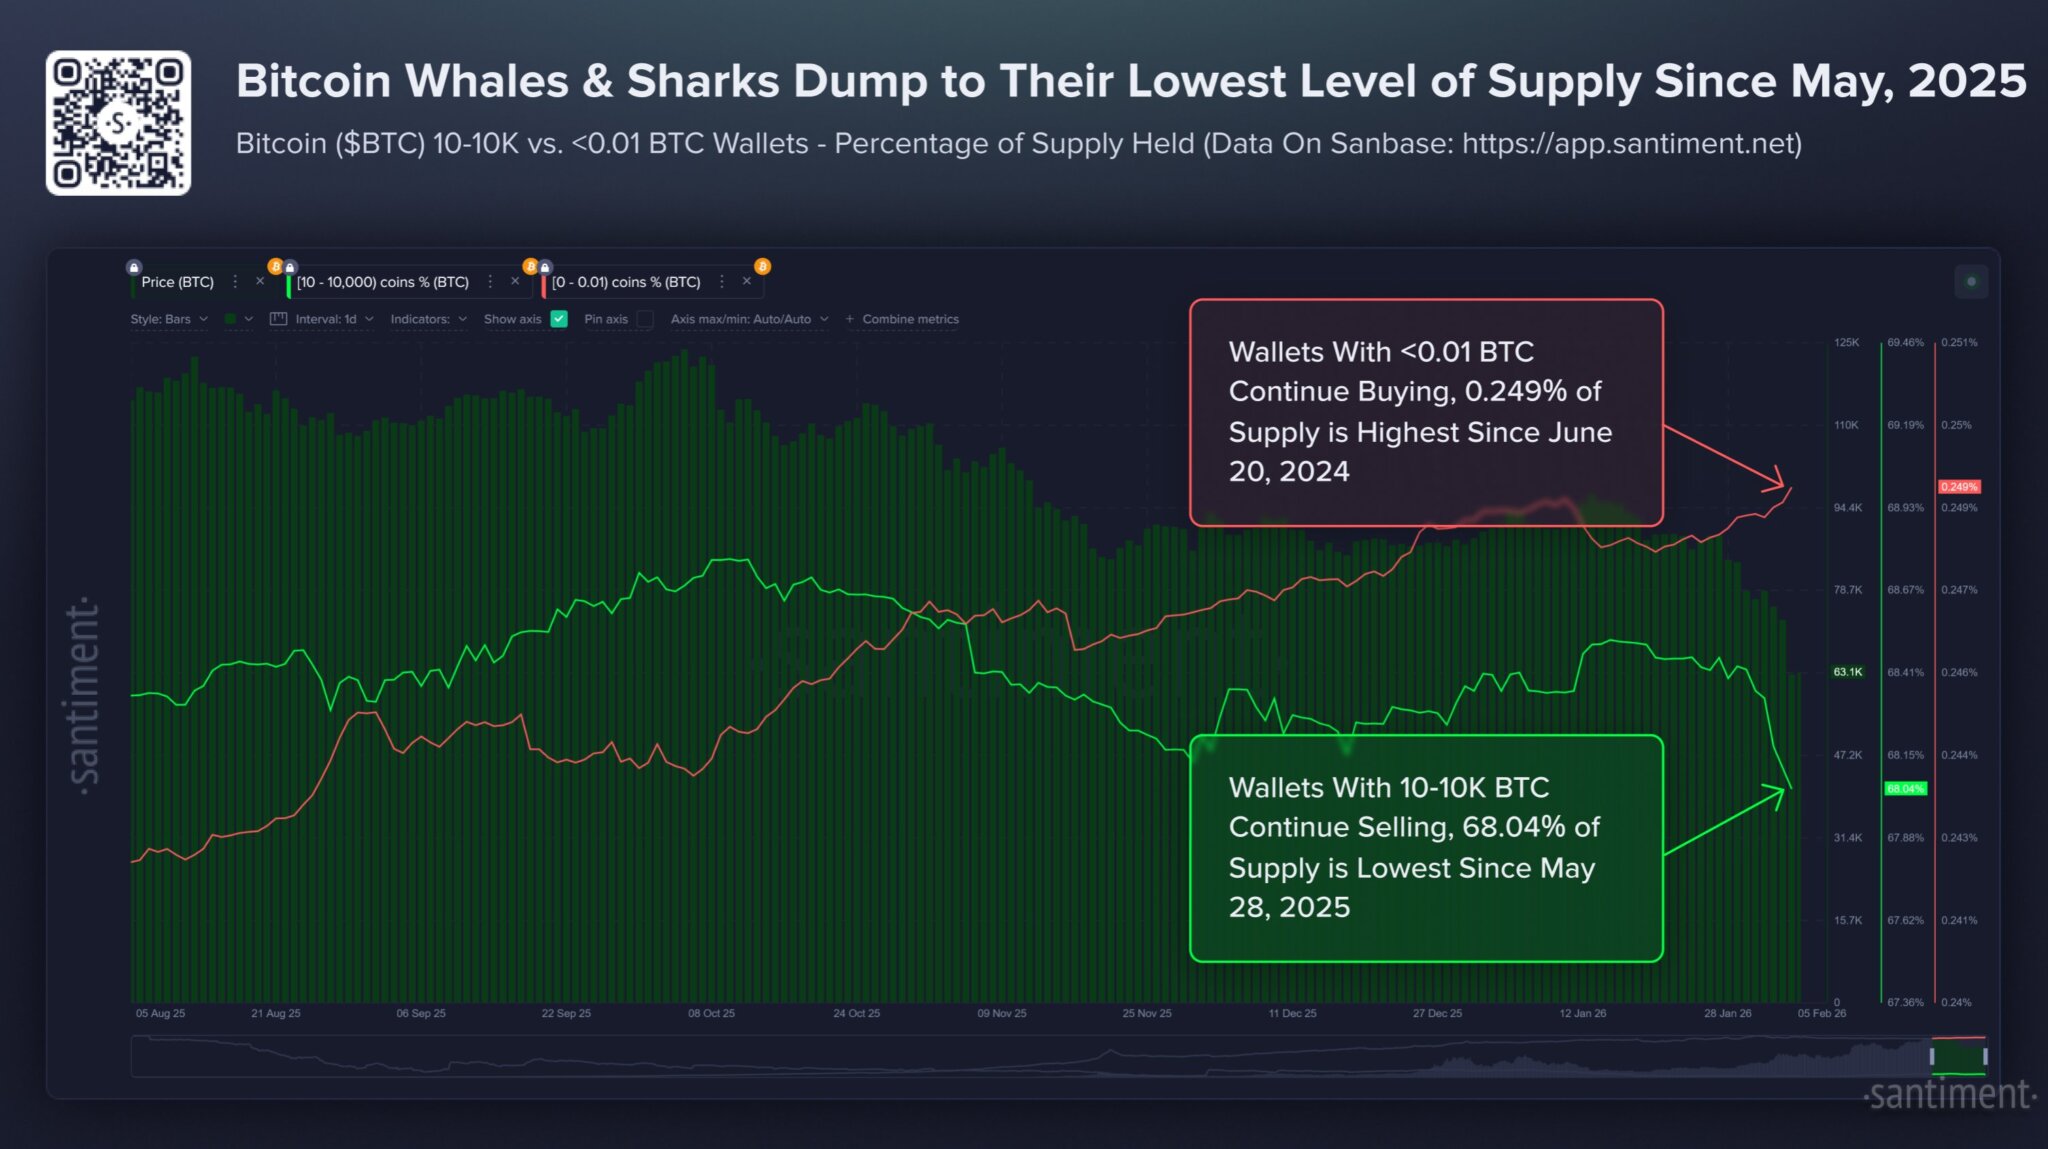
(Source: Santiment)
Santiment’s data provides the most direct evidence of whale selling. Wallets holding 10 to 10,000 BTC have net reduced by 81,068 BTC over eight days, reaching a nine-month low and representing 68.04% of the total supply. Meanwhile, “small wallets” holding less than 0.01 BTC have risen to their highest in 20 months. This redistribution pattern clearly shows large holders transferring coins to smaller wallets, often during panic selling in price declines.
The sale of 81,068 BTC is a major event historically. At an average price of $80,000, this amounts to about $6.48 billion leaving large holders’ hands. Such a scale of sell-off cannot happen without impacting the market price; in fact, it’s likely a primary driver pushing prices down from $90,000 to $60,000.
Why are whales choosing to sell now? Possible reasons include: locking in profits (many whales bought at lower prices and can still profit even after selling at $80,000), risk management (worsening macro conditions prompting institutions to reduce crypto exposure), margin calls (if whales use leverage or collateralize BTC, falling prices trigger margin requirements), and tactical repositioning (expecting further short-term declines and waiting to buy back lower).
The increase in small wallets is also noteworthy. Retail investors often buy the dip during whale sell-offs—sometimes capturing the bottom, but often incurring further losses. Current accumulation by small investors can slow down the decline temporarily, but rarely overcomes the market impact of leverage resets and whale position volatility. Only when retail buying volume is sufficient to absorb whale sales can prices truly stabilize.
Unusual Whale Ratio of 0.447: Binance as the Main Selling Venue
CryptoQuant’s data reveals details of whale selling execution. The exchange whale ratio (30-day moving average) has surged to 0.447, the highest since March 2025. An increasing whale ratio indicates a disproportionately large inflow of assets from the biggest players, often associated with whales preparing to sell, hedge, or reposition.
Additional data quantifies these deposits: in early February, Binance received about 78,500 BTC, with approximately 38,100 BTC from whale inflows, meaning whales’ deposits account for about 48.5% of total deposits. This ratio is highly abnormal; normally, exchange deposits are more dispersed. When a single group controls nearly half of the deposits, their influence on price movements is exponentially amplified.
Binance, as the world’s largest trading platform by volume, is a key indicator. Whales choosing Binance as a selling venue is due to its deep liquidity and global user base. Selling large amounts of BTC on Binance results in less slippage and market impact. However, even Binance’s liquidity can face significant pressure when facing concentrated sell orders of 38,100 BTC.
Three Major Warnings from the 0.447 Whale Ratio
Prepared for Selloff: Whales have moved assets to immediately executable trading accounts.
Strong Market Control: Nearly half of deposits are from whales, giving them decisive influence over price trends.
Historical Highs: Reaching levels last seen in March 2025, after which the market also experienced significant corrections.
It’s important to note that this data does not guarantee an immediate selloff. Large deposits may be used for derivative hedging, collateral transfers, or internal fund reorganization. Whales might be merely hedging for potential declines via futures market shorts, rather than directly selling spot holdings. Still, in the context of rapid price drops and cascade liquidations, such large deposits further confirm the view that large institutions actively intervene on the supply side amid liquidity stress.
ETF Outflows and Realized Losses Hit New Highs
The most tangible negative factor is the continuous selling of US spot Bitcoin ETFs. According to SoSo Value, over the past four months, net outflows from spot Bitcoin ETFs have exceeded $6 billion. This persistent withdrawal is significant because it changes the other side of the market. When inflows are strong, the market relies on stable, price-insensitive buyers. When outflows persist, this support weakens, and prices tend to fall as buy-side liquidity diminishes.
Bloomberg ETF analyst James Seyffart notes that ETF holders have suffered the largest losses since the ETF’s launch in January 2024. These ETFs are experiencing their worst Bitcoin correction, with about 42% decline, and Bitcoin prices below $73,000. While these aren’t immediate trigger events, they alter market structure. In a market accustomed to steady ETF demand, ongoing outflows weaken “automatic dip buyers,” making stop-losses and liquidations more severe during downturns.
Glassnode data shows that on February 4, the realized loss (7D SMA) for Bitcoin reached $889 million per day—the highest since November 2022. This pattern typically appears during large-scale loss-selling, consistent with sharp price declines. Glassnode also indicates that key on-chain price models are much higher: short-term holder (STH) cost basis at $94,000, active investor average at $86,800, and real market average at $80,100. When spot prices fall to $60,000, nearly all short-term buyers are in loss.
Selling doesn’t need to be extremely violent to be meaningful; it only needs to be sustained enough to suppress rebounds and weaken liquidity at key levels. Once Bitcoin breaks below critical levels, forced selling accelerates the decline. CoinGlass data shows over $1.2 billion in liquidations, illustrating how free-floating sell-offs can turn into mechanical cascades.
Macro Deleveraging and Liquidity Crisis: The Perfect Storm
The final explanation is macro-level. During market stress, Bitcoin increasingly behaves like a liquidity-sensitive risk asset. Reuters links overall market sentiment with unwinding of leverage and speculative positions across various assets, including cryptocurrencies, as investors seek risk aversion. Commodities like gold and silver also declined sharply, indicating pressure isn’t limited to crypto. When speculative assets and traditional “defensive” positions are sold simultaneously, liquidity can tighten rapidly.
The US stock market has also heightened risk-off sentiment. Reuters reports tech stocks led declines amid doubts about AI investment returns. January saw the highest layoffs in 17 years, possibly prompting broader re-pricing of growth and risk. This is significant for Bitcoin because macro-driven de-risking often impacts the most liquid and responsive markets first.
The current price action aligns with this pattern. ETF outflows weaken marginal buy support, spot prices break key levels, triggering derivative liquidations, and on-chain data shows realized losses and whale deposits increasing amid volatility. From a chart perspective, it resembles a “black swan,” but in reality, it’s akin to a liquidity event in the pipeline—multiple weak points collapsing simultaneously, not a single explosion.
