
Pippin is seeing a strong move today. The PIPPIN price is up more than 30% at writing, trading around $0.6649. Trading volume has jumped over 80%, and the token is the top gainer in the market. This is not a quiet move, it came with strong activity behind it.
The main driver appears to be heavy capital inflow. Volume surged to roughly $73.3 million in 24 hours, up more than 92%. That kind of turnover, nearly 11% of its market cap, shows real money stepped in.
This was not a low-volume spike. This jump wasn’t empty. Real buying showed up in the spot market, and that’s what pushed price higher. When price and volume rise together, it shows that traders are actually stepping in, not just watching from the sidelines.
If this run is going to hold, activity needs to stay strong. If trading slows down, the momentum can fade just as quickly.
If trading activity holds above the $50 million range, it would show that interest is still there. If volume fades quickly, the rally could cool just as fast.
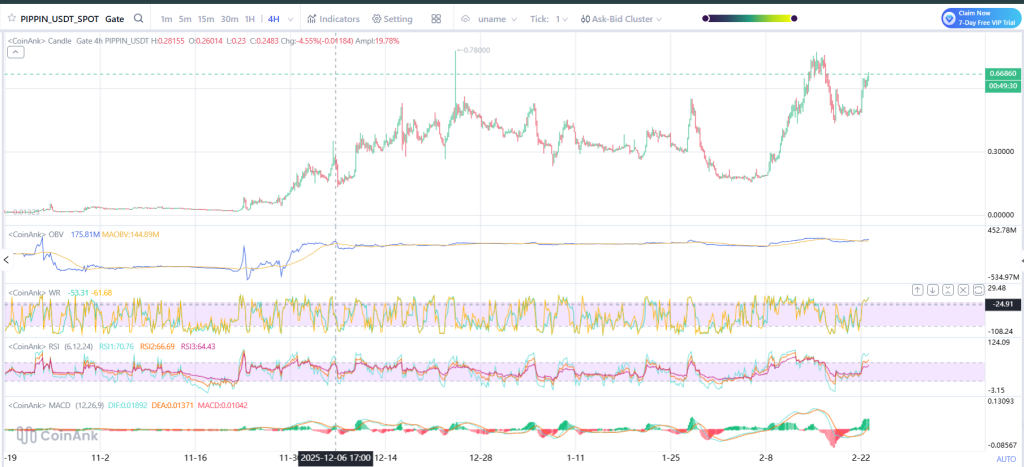
What the PIPPIN Chart Is Showing
On the 4H chart, PIPPIN had been trading sideways for weeks after pulling back from its previous highs.
The PIPPIN Price built a base in the lower range before breaking out sharply. The recent move pushed it back toward the $0.66–$0.68 area, which is close to prior local highs.
Price spent weeks moving sideways, then suddenly broke out of that range. After the drop near $0.30 earlier this month, buyers came in hard and haven’t really stepped away.
Since then, the move has been building step by step. The latest breakout looks like the next leg of that recovery.
_****Here are 6 Ultra Growth Stocks for 2026**
Source: Coinank
What the Indicators Say
OBV is rising, which means buying pressure has increased compared to earlier weeks. That supports the price action.
The RSI is now elevated, sitting in the higher range, which shows strong momentum. At the same time, it warns that the token may be stretched in the short term.
MACD has flipped positive with green histogram bars printing again. That shows upward momentum is gaining pace. If these indicators stay aligned and volume remains strong, the PIPPIN price could try to hold its breakout.
For now, this rally is backed by real activity. The next few sessions will show whether buyers keep control or if traders start taking profits after the sharp 30% run.
Disclaimer: The information on this page may come from third parties and does not represent the views or opinions of Gate. The content displayed on this page is for reference only and does not constitute any financial, investment, or legal advice. Gate does not guarantee the accuracy or completeness of the information and shall not be liable for any losses arising from the use of this information. Virtual asset investments carry high risks and are subject to significant price volatility. You may lose all of your invested principal. Please fully understand the relevant risks and make prudent decisions based on your own financial situation and risk tolerance. For details, please refer to
Disclaimer.
Related Articles
Trump's Ultimatum to Iran Fails to Materialize, BTC Stabilizes After Breaking Below $70,000 Over the Weekend
QCP Group points out that Trump's ultimatum to Iran failed to materialize, and the market stabilized briefly. Despite BTC breaking below 70,000, its resilience has strengthened. With U.S. national debt exceeding 3.9 trillion, stagflation concerns intensify, and central banks face policy dilemmas. Iran proposed settling transit fees in yuan, and the market should monitor shifts in BTC.
GateNews11m ago
Crypto Analyst Hints at ADA Price Uptick Based on Weekly Chart
Crypto analyst Ali Charts predicts a potential rise in ADA prices, currently up 5.50% in the last 24 hours. He suggests the token may surge further over the next three months based on historical price patterns and current market analysis.
TheNewsCrypto26m ago
BCH Shows Promising Buy Signal Traders Can’t Ignore
BCH holds key $440 support, showing potential for a short-term rebound.
The 4-hour chart indicates bullish flip with strong OBV and DMI signals.
Next targets lie at $494, $510, and possibly $570 if Bitcoin rises further.
Bitcoin Cash — BCH, has captured traders’ attention this week with
CryptoNewsLand41m ago
QNT Rally Tests a Crucial Supply Zone — What Next for Quant?
QNT rallied 24% weekly, testing a key supply zone near $80–$88.
Daily closes above $88 signal bullish continuation, while drops below $75 indicate renewed bearish pressure.
Short-term momentum is positive, but higher timeframe indicators suggest cautious trading.
Quant — QNT, has
CryptoNewsLand46m ago
Gold, Bonds, and Bitcoin: The Three Major Truth Revealers of Financial Markets
The article analyzes the recent performance of gold, bonds, and Bitcoin in current financial markets and the reasons behind it. Recently, rising bond yields, falling gold prices, and rising Bitcoin have demonstrated the market's reaction to uncertainty. Particularly in the Iran conflict, a liquidity crisis led to gold selloffs, while Bitcoin, as a non-sovereign asset, has gained favor. Looking ahead, oil prices are expected to continue rising, putting pressure on bonds and gold, with Bitcoin outperforming other assets. Financial markets will be significantly influenced by geopolitical factors.
金色财经_53m ago
Zcash News: Smart money quietly increasing holdings after ZEC's 55% pullback; the key breakout level is at $227
Zcash (ZEC) is currently oscillating around $226, facing pressure from a descending channel. Despite the appearance of bullish divergence and increased holdings by some investors, the market remains predominantly bearish. If it holds the $227 support level, it could potentially rally to targets such as $267; if it breaks below, it may test $191. Core factors include the stability of support levels and capital flow dynamics.
GateNews1h ago
