小崔带你看K线
There’s not much movement in the market today, it’s Saturday and things are pretty stagnant—if you want to take a position, you can try a short at 134 to catch 132, or a long at 132 to catch 134, but honestly, making just one or two points isn’t that meaningful.
2025.12.6 SOL
4-hour chart analysis
Bollinger Bands Analysis
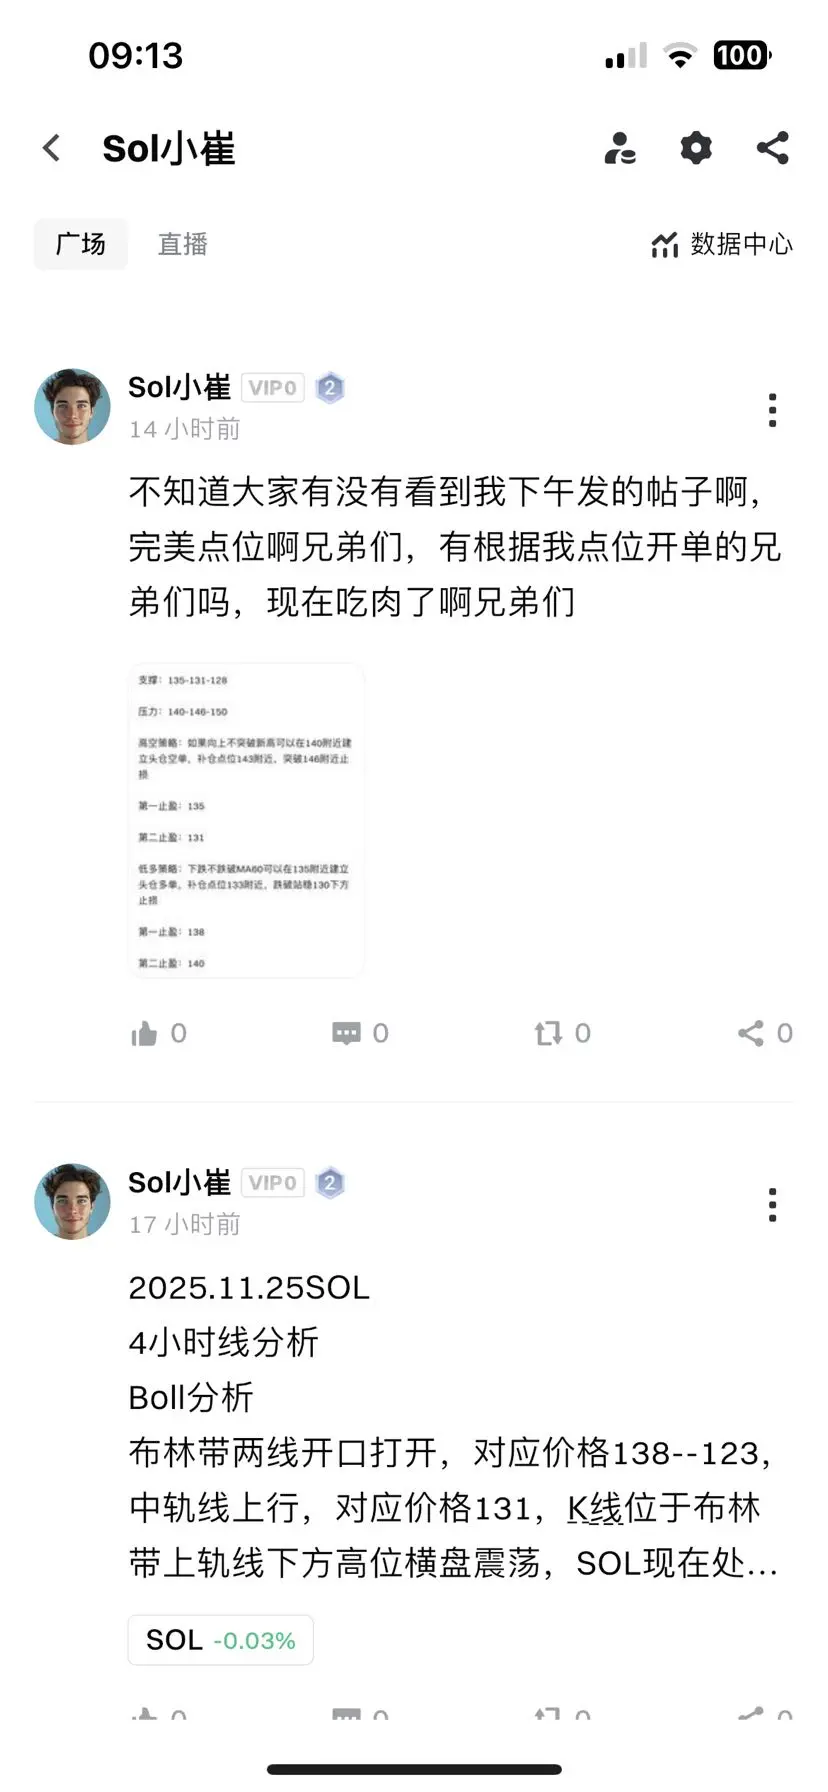
The Bollinger Bands are tightening, corresponding to a price range of 147-131. The middle band is trending downward at 139. The candlestick is showing a slight rebound after breaking below the lower Bollinger Band, and SOL is currently consolidating sideways above the low
2025.12.6 SOL
4-hour chart analysis
Bollinger Bands Analysis
The Bollinger Bands are tightening, corresponding to a price range of 147-131. The middle band is trending downward at 139. The candlestick is showing a slight rebound after breaking below the lower Bollinger Band, and SOL is currently consolidating sideways above the low
SOL-2.62%