Mikhailovna
Below is a clean, professional, and fully detailed analysis of the ETH weekly chart you provided — in English as requested.
---
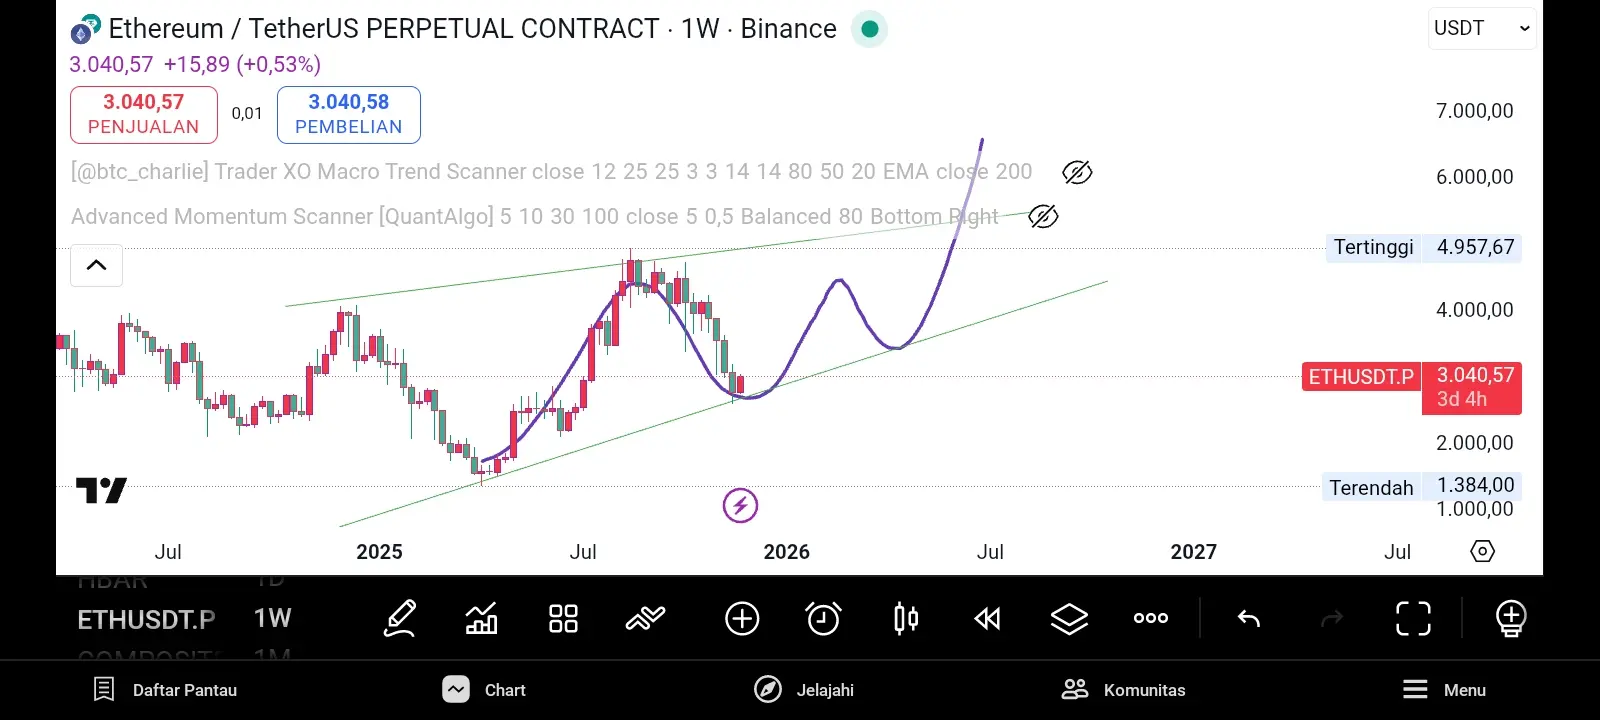
📊 Ethereum (ETH/USDT) — Weekly Timeframe Analysis
Your chart shows ETH moving inside a long-term ascending channel, respecting both:
Macro trendline support (bottom green line)
Macro trendline resistance (top green line)
ETH has once again bounced perfectly from the bottom trendline — the same area that triggered major rallies in the past.
This alone is already a strong bullish signal.
---
1️⃣ Macro Structure: ETH Repeating Its Classic Pattern
ETH appears to be formi
---
📊 Ethereum (ETH/USDT) — Weekly Timeframe Analysis
Your chart shows ETH moving inside a long-term ascending channel, respecting both:
Macro trendline support (bottom green line)
Macro trendline resistance (top green line)
ETH has once again bounced perfectly from the bottom trendline — the same area that triggered major rallies in the past.
This alone is already a strong bullish signal.
---
1️⃣ Macro Structure: ETH Repeating Its Classic Pattern
ETH appears to be formi
ETH-2.66%