
#Gate广场AI测评官
- 短期(1–3天):大概率在 $2000–2085 區間震盪;$2100 不破則偏空
- 中期(1週):$2100 不破則反彈以修復為主,中期空頭邏輯未變
- 操作參考
- 低多:$2000–2010 輕倉試多,止損 $1985,目標 $2055→2080
- 高空:$2055–2060 承壓做空,止損 $2090,目標 $2010→1990
- 觀望:等待PPI後放量突破 $2100 或跌破 $19
查看原文- 短期(1–3天):大概率在 $2000–2085 區間震盪;$2100 不破則偏空
- 中期(1週):$2100 不破則反彈以修復為主,中期空頭邏輯未變
- 操作參考
- 低多:$2000–2010 輕倉試多,止損 $1985,目標 $2055→2080
- 高空:$2055–2060 承壓做空,止損 $2090,目標 $2010→1990
- 觀望:等待PPI後放量突破 $2100 或跌破 $19


【當前用戶分享了他的交易卡片,若想瞭解更多優質交易資訊,請到 App 版查看】
- 讚賞
- 1
- 2
- 轉發
- 分享
浩南陈恭喜发财大吉大利版 :
:
新年快樂 🧨查看更多


馬币火
Malaysian Ringgit
創建人@Crypto King2026
上市進度
100.00%
市值:
$1986.98
更多代幣
$STRC
那是那條推文
😎😎
查看原文那是那條推文
😎😎

- 讚賞
- 按讚
- 留言
- 轉發
- 分享
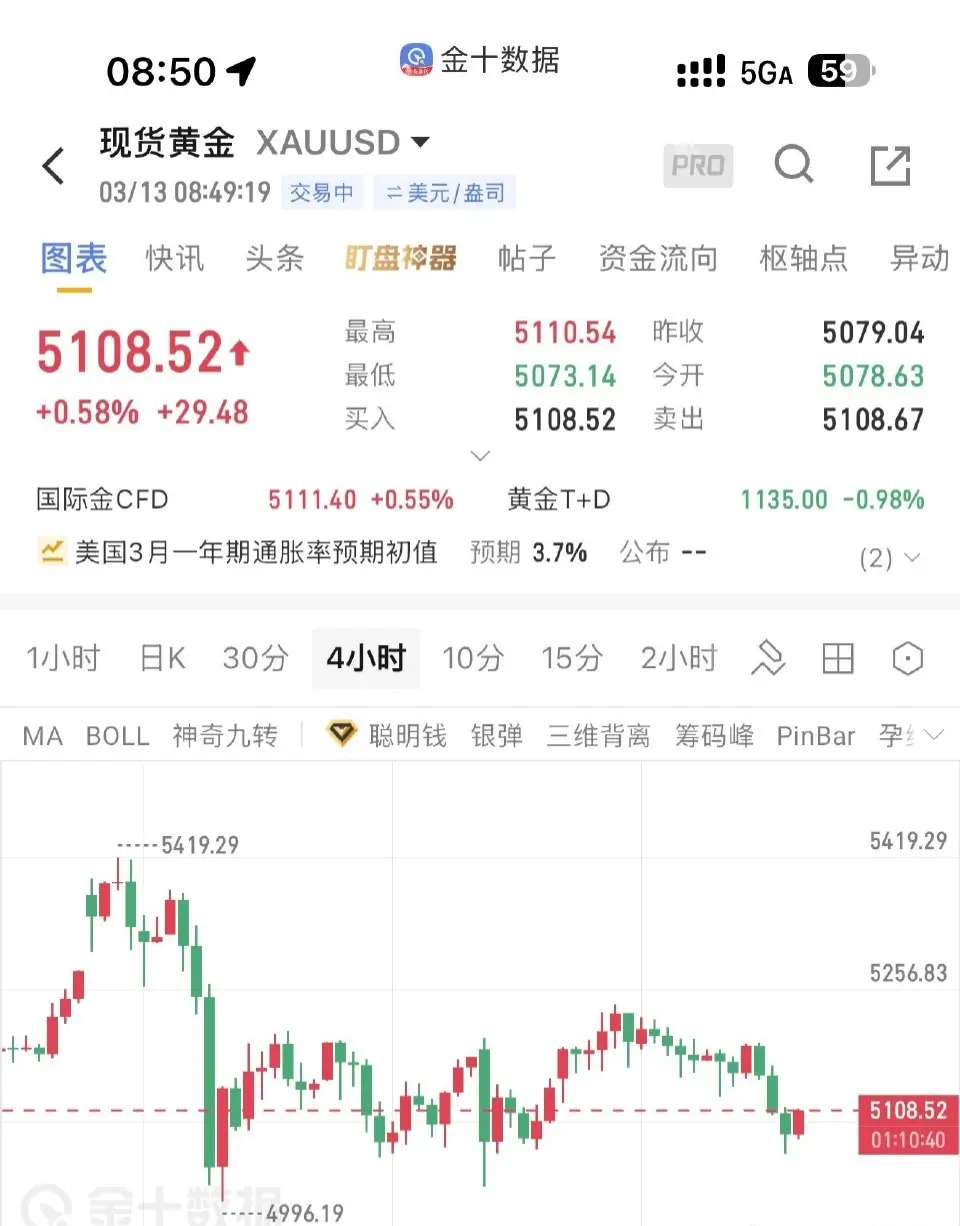
亮哥日進斗金—周五黃金早間交易計劃!
黃金的這波下跌情緒經過昨夜的再度釋放已經基本消化完畢。從技術圖形上看,4小時和1小時級別都呈現出較為強勁的多頭上攻態勢,短期上漲動能充足。
基於上述判斷,我計劃在5108的價位(早盤現價)入場做多。
為了防範分析失誤或突發消息,防守設置在5090,目標初步看向 5138-5150。
查看原文黃金的這波下跌情緒經過昨夜的再度釋放已經基本消化完畢。從技術圖形上看,4小時和1小時級別都呈現出較為強勁的多頭上攻態勢,短期上漲動能充足。
基於上述判斷,我計劃在5108的價位(早盤現價)入場做多。
為了防範分析失誤或突發消息,防守設置在5090,目標初步看向 5138-5150。
- 讚賞
- 2
- 留言
- 轉發
- 分享


- 讚賞
- 按讚
- 留言
- 轉發
- 分享


GM to @chartseekers Fam☕️⚰️
每張圖表都在講述一個故事。每個錯誤都教會你一堂課。每一天都給你另一個改進的機會。
#ChartSeekers # GoodMorning #StayDisciplined #KeepLearning
查看原文每張圖表都在講述一個故事。每個錯誤都教會你一堂課。每一天都給你另一個改進的機會。
#ChartSeekers # GoodMorning #StayDisciplined #KeepLearning

- 讚賞
- 2
- 留言
- 轉發
- 分享
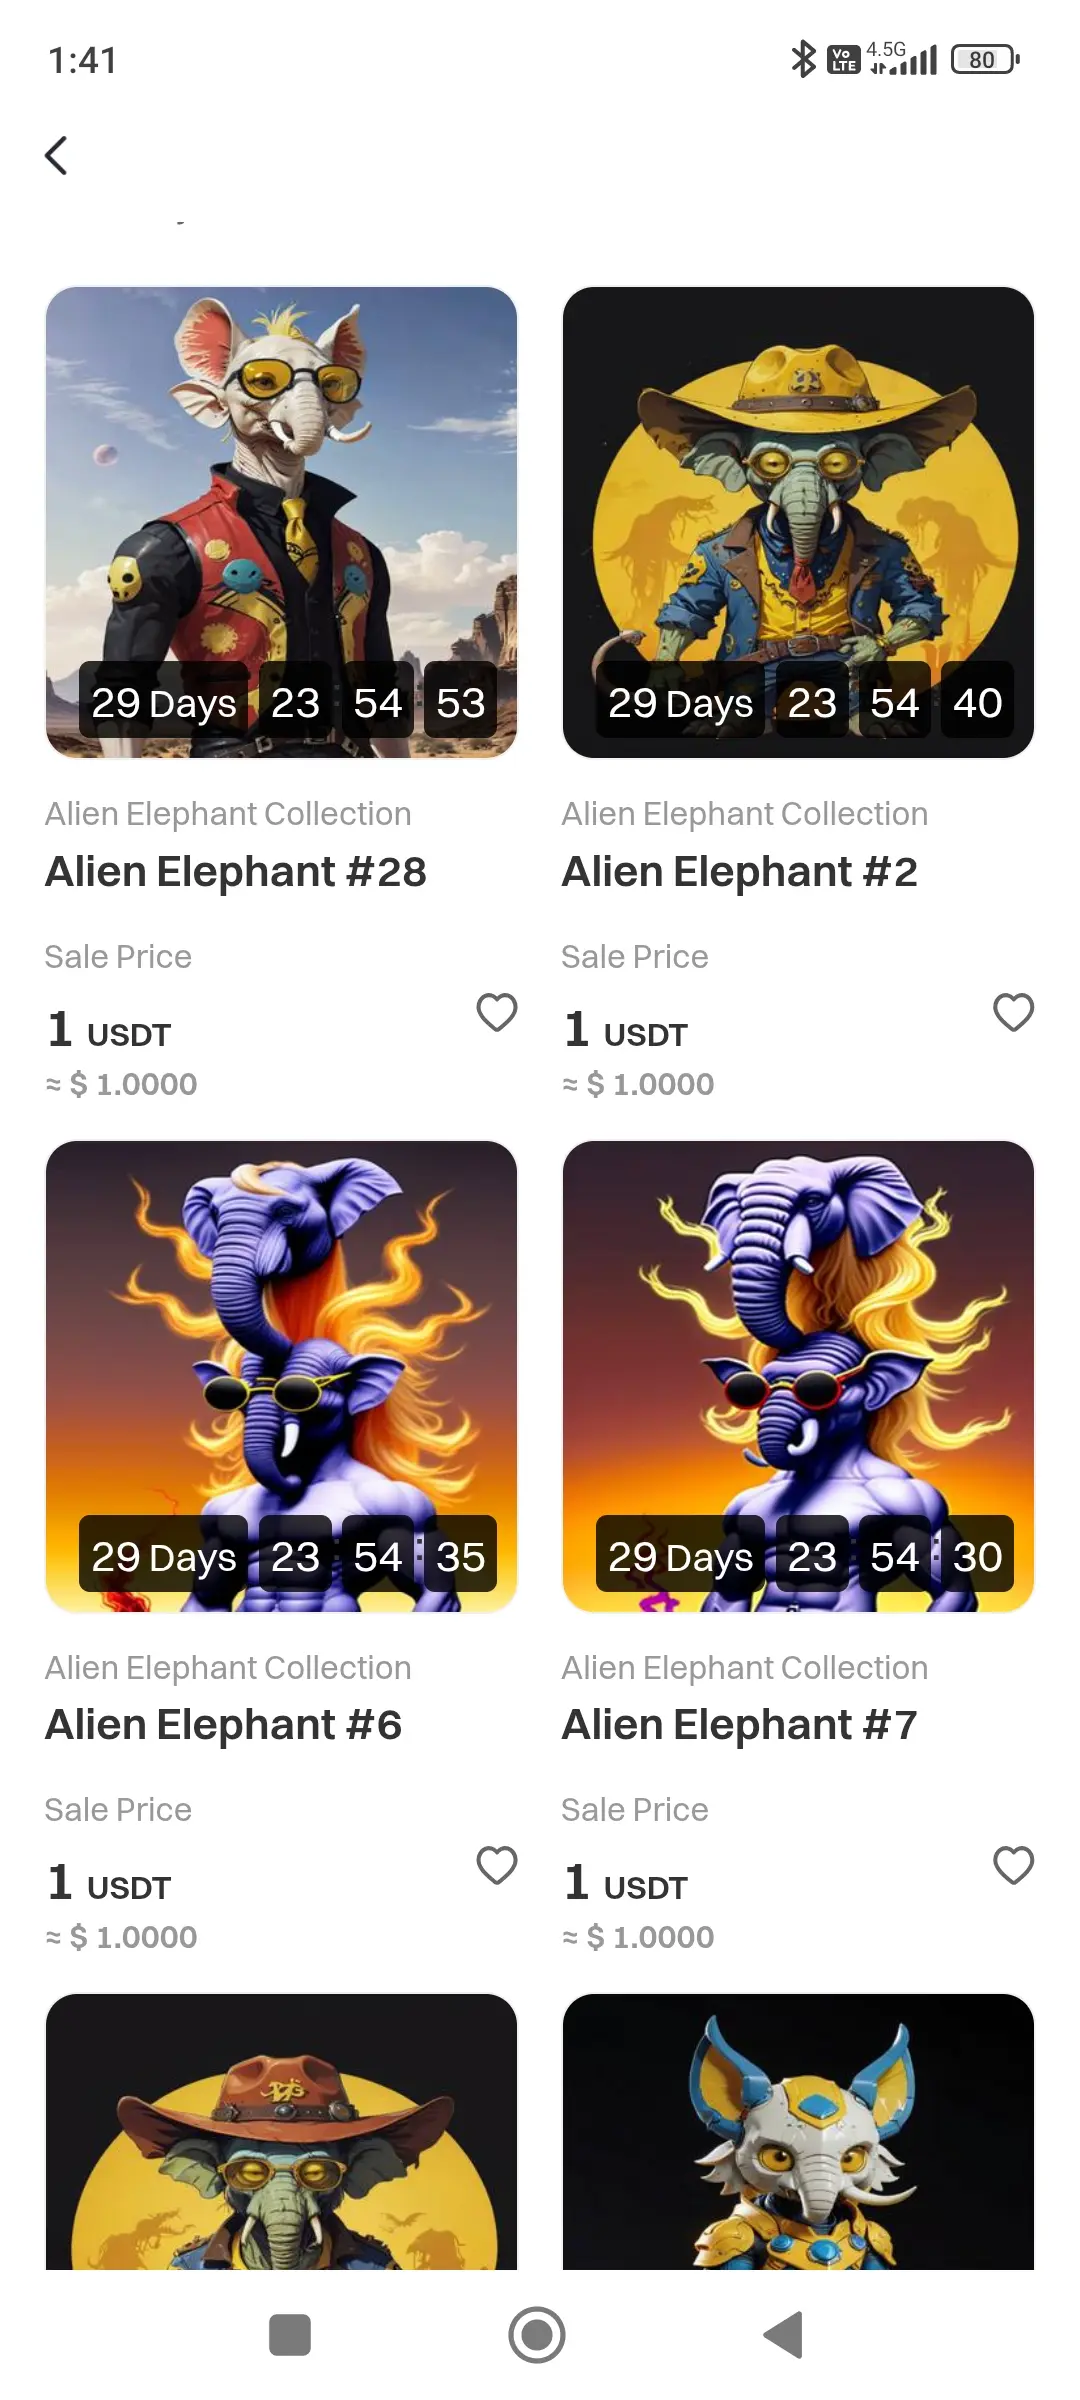
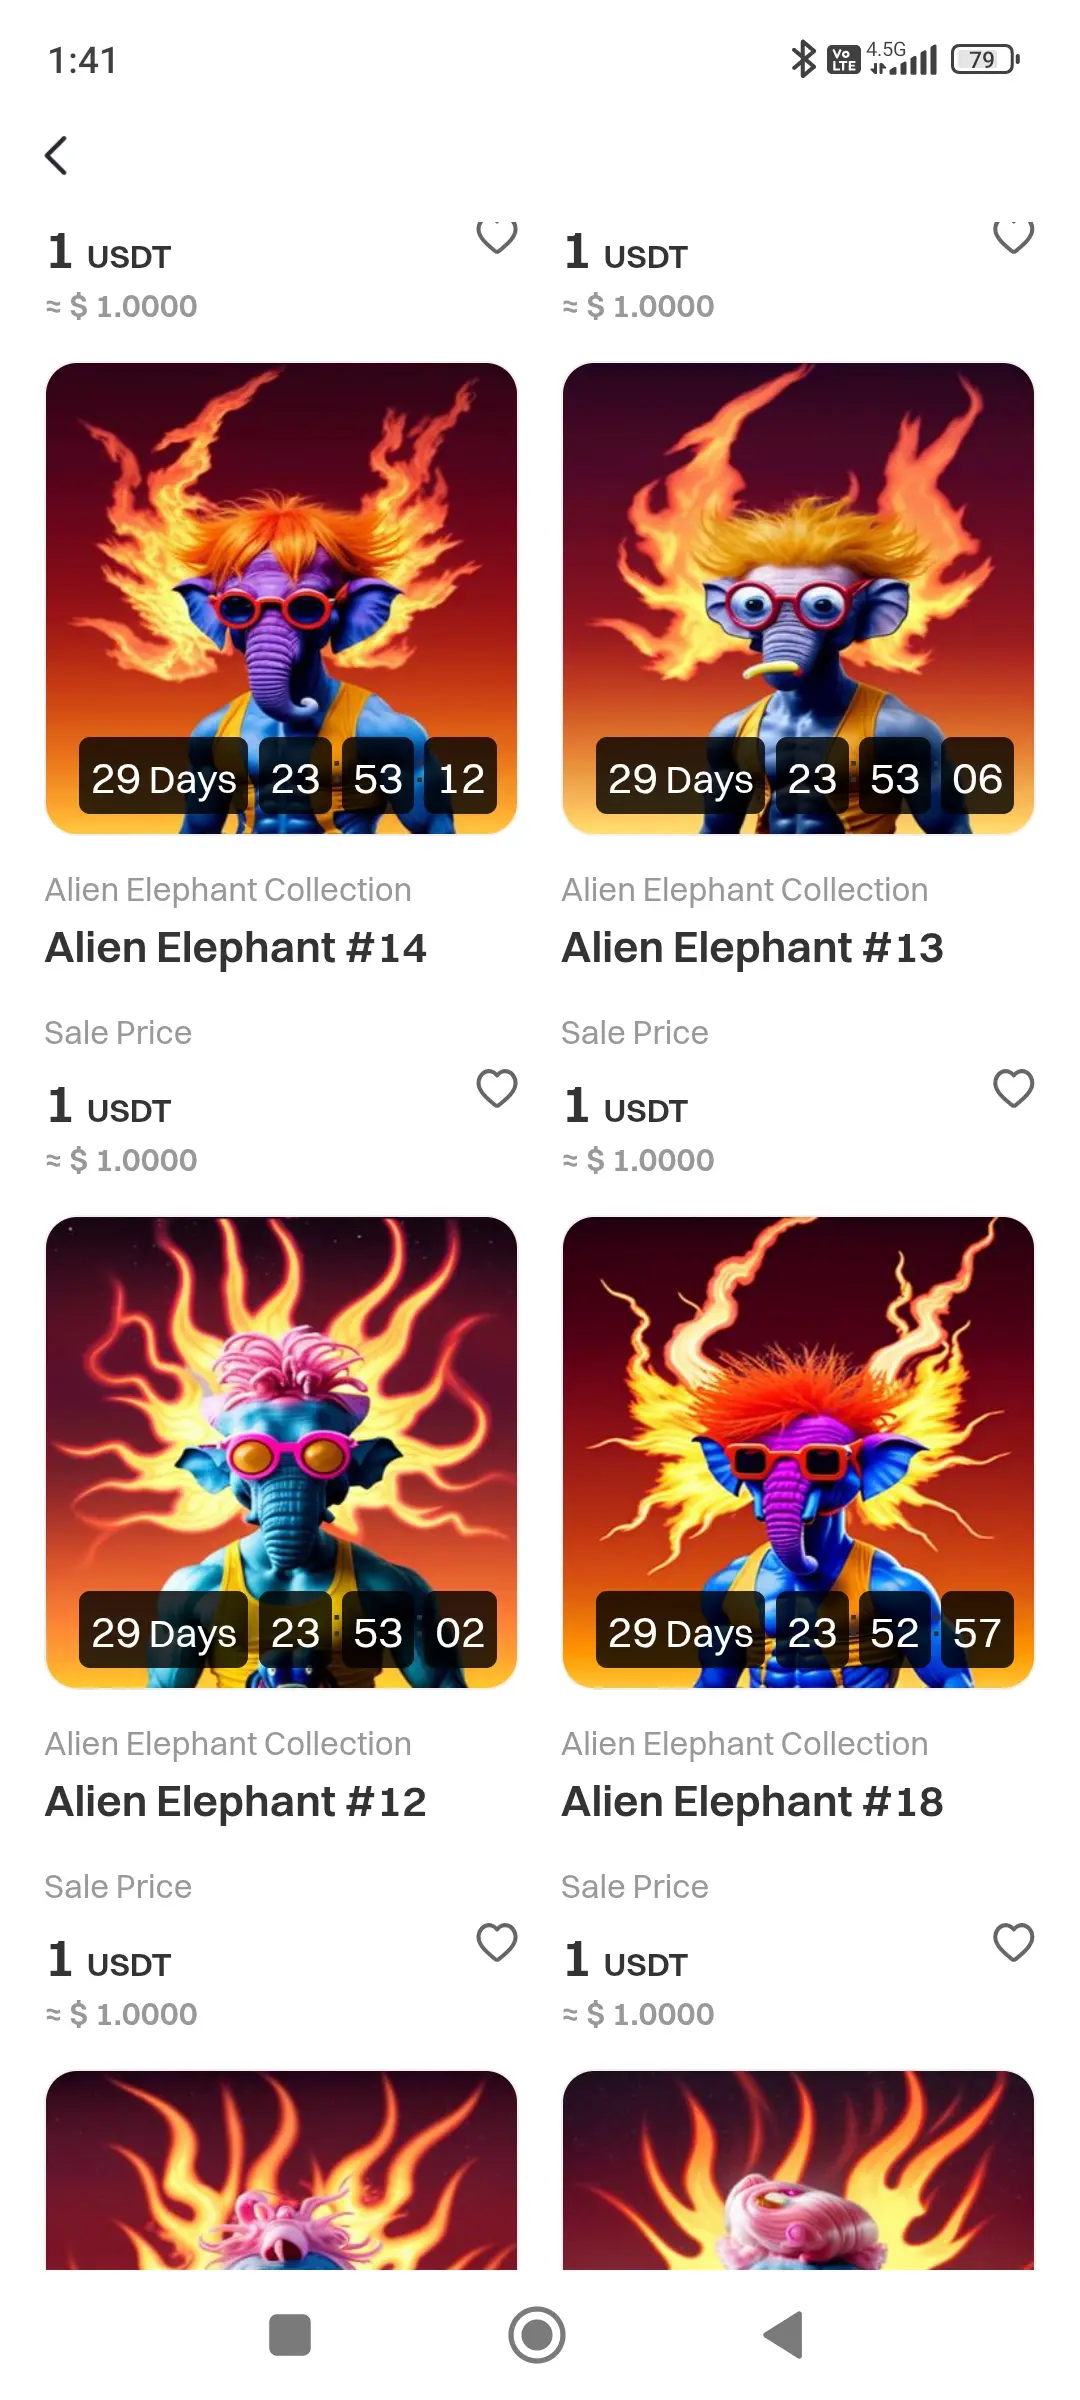
https://www.gate.com/nft/collection/21394/Alien-Elephant-Collection
進入NFT世界的門票只需1 USDT!🎟️
想購買NFT但又擔心價格過高嗎?現在正是擁有你的第一個數字資產的最佳時機,來體驗Alien Elephant系列吧。
🚨為什麼要購買?
💎象徵性價格 (1 USDT
💎獨特的設計
💎在Gate.io的保障下輕鬆買賣
查看原文進入NFT世界的門票只需1 USDT!🎟️
想購買NFT但又擔心價格過高嗎?現在正是擁有你的第一個數字資產的最佳時機,來體驗Alien Elephant系列吧。
🚨為什麼要購買?
💎象徵性價格 (1 USDT
💎獨特的設計
💎在Gate.io的保障下輕鬆買賣

- 讚賞
- 2
- 留言
- 轉發
- 分享
goushi
狗屎
創建人@适势而为
認購進度
0.00%
市值:
$0
更多代幣


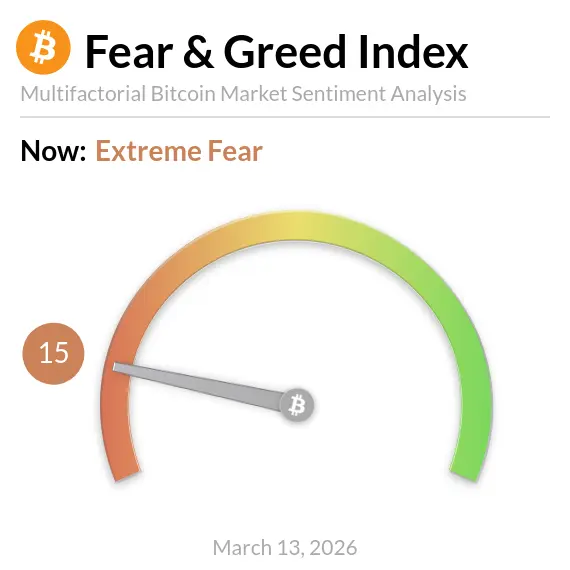
3.13 Bitcoin Market Analysis
Bitcoin Daily Chart - Four consecutive bullish candles, morning strong breakout above previous highs, Bollinger Bands slowly widening, price trading below upper band, overall strong momentum.
Technical indicators: KDJ crossover golden cross, MACD dual lines diverging upward, volume slightly expanding, short-term bulls dominating.
Last night U.S. stocks opened and closed lower, but Bitcoin did not follow suit, mainly supported by continuous spot ETF capital inflows.
However, macro uncertainty remains - Middle East situation and Iran tensions are potential risks; if
查看原文Bitcoin Daily Chart - Four consecutive bullish candles, morning strong breakout above previous highs, Bollinger Bands slowly widening, price trading below upper band, overall strong momentum.
Technical indicators: KDJ crossover golden cross, MACD dual lines diverging upward, volume slightly expanding, short-term bulls dominating.
Last night U.S. stocks opened and closed lower, but Bitcoin did not follow suit, mainly supported by continuous spot ETF capital inflows.
However, macro uncertainty remains - Middle East situation and Iran tensions are potential risks; if

- 讚賞
- 1
- 1
- 轉發
- 分享
星遥日进斗金:
➕企鹅 390
331
95😊😊34

3.13 Morning Big Coin Silk Road
Big Coin has surged strongly from the 69150 low, breaking through the key resistance zone of 70500-71000, with a large bullish candle confirming the breakout. Bulls are in complete control, and the short-term trend is clearly pointing upward.
Indicator Signals: Bollinger Band bandwidth expanding, volatility increasing, bullish momentum continuously releasing, with potential for further upside in the market.
Operation Reference
Aggressive Trend Following: Following the 71000 support level and adding long positions, targeting 72000-72500
Steady Low Long: Retest at
查看原文Big Coin has surged strongly from the 69150 low, breaking through the key resistance zone of 70500-71000, with a large bullish candle confirming the breakout. Bulls are in complete control, and the short-term trend is clearly pointing upward.
Indicator Signals: Bollinger Band bandwidth expanding, volatility increasing, bullish momentum continuously releasing, with potential for further upside in the market.
Operation Reference
Aggressive Trend Following: Following the 71000 support level and adding long positions, targeting 72000-72500
Steady Low Long: Retest at

- 讚賞
- 1
- 1
- 轉發
- 分享
趋势蛟龙:
2~1~7~9~3~4~9~8~1~7=🐧 看
⬆️
面
=哏
䒟
這兩天雖然一直沒有放量,當整體還是處於一個慢漲的狀態。我們在上個周末底部有減倉所以並沒有太著急。今天早上也是直接放量破位,突破了這幾天的壓制位。目前的話不要著急跑,我們的位置很優勢。這麼個走法,下半個月就有可能走主升浪不要賣飛了。
技術機構上來看,小時級別在這兩天來看是在做一個清洗的過程。一直在上下拉扯,不過整體的低點還是在不斷的抬高。日線級別不用說,連續幾天走出小陽k。今天早上更是放量突破了,這周的周k想要收下來已經是非常困難了。佈局進行低哆為主,還是那句話拿住等主升浪。前期我們做t已經有利潤了完全不用怕。
大餅目標 看到83000#伊朗明确达成停火协议要求
技術機構上來看,小時級別在這兩天來看是在做一個清洗的過程。一直在上下拉扯,不過整體的低點還是在不斷的抬高。日線級別不用說,連續幾天走出小陽k。今天早上更是放量突破了,這周的周k想要收下來已經是非常困難了。佈局進行低哆為主,還是那句話拿住等主升浪。前期我們做t已經有利潤了完全不用怕。
大餅目標 看到83000#伊朗明确达成停火协议要求
BTC2.17%


- 讚賞
- 按讚
- 留言
- 轉發
- 分享
#GateDerivativesHitsNewHighInFebruary 加密貨幣衍生品市場繼續以驚人的速度擴展,2月份証明瞭這是該行業又一個裡程碑式的月份。最大的亮點之一來自Gate.io,其衍生品交易活動在該月份飆升至歷史新高。這一成就不僅反映了該平台的快速增長,也反映了全球對高級加密交易工具日益增長的需求。
根據最近的報告,Gate.io上的衍生品交易量在2月份大幅攀升,這得益於市場參與度的提高和交易基礎設施的改善。加密衍生品——包括期貨和永續合約——已成為數字資產生態系統的重要組成部分。它們允許交易者對沖風險、推測價格波動,並在上升和下跌市場中最大化機會。
這波浪潮的一個關鍵原因是加密市場的整體復甦和對其的重新關注。比特幣和以太坊等主要加密貨幣在近幾個月內經歷了強勁的交易活動。隨著價格波動性的增加,交易者往往轉向衍生品市場來利用短期波動。提供深度流動性、具有競爭力的費用和高級工具的平台自然會吸引更高的交易量。
促成新高的另一個因素是交易功能和安全標準的不斷改進。Gate.io通過引入更多交易對、增強的風險管理系統和更順暢的用户體驗來擴展其衍生品生態系統。這些改進使該平台對專業交易者和首次探索衍生品交易的新手都很有吸引力。
衍生品交易的增長也突出了加密行業的更廣泛趨勢。在過去幾年中,許多交易所上衍生品市場的增長速度快於現貨市場。交易者對槓桿、對沖策略和靈活的交易產品的興趣
查看原文根據最近的報告,Gate.io上的衍生品交易量在2月份大幅攀升,這得益於市場參與度的提高和交易基礎設施的改善。加密衍生品——包括期貨和永續合約——已成為數字資產生態系統的重要組成部分。它們允許交易者對沖風險、推測價格波動,並在上升和下跌市場中最大化機會。
這波浪潮的一個關鍵原因是加密市場的整體復甦和對其的重新關注。比特幣和以太坊等主要加密貨幣在近幾個月內經歷了強勁的交易活動。隨著價格波動性的增加,交易者往往轉向衍生品市場來利用短期波動。提供深度流動性、具有競爭力的費用和高級工具的平台自然會吸引更高的交易量。
促成新高的另一個因素是交易功能和安全標準的不斷改進。Gate.io通過引入更多交易對、增強的風險管理系統和更順暢的用户體驗來擴展其衍生品生態系統。這些改進使該平台對專業交易者和首次探索衍生品交易的新手都很有吸引力。
衍生品交易的增長也突出了加密行業的更廣泛趨勢。在過去幾年中,許多交易所上衍生品市場的增長速度快於現貨市場。交易者對槓桿、對沖策略和靈活的交易產品的興趣


- 讚賞
- 4
- 3
- 轉發
- 分享
repanzal :
:
好的 太好了 继续加油 谢谢分享这些杰出的信息给我 我真的非常感谢查看更多
#CryptoEntersRetirementPortfolios 🚨 沒有人在談論的安靜金融轉變
退休資本正在進入加密貨幣
十多年來,加密貨幣一直處於金融的邊緣。
早期採用者。
散戶交易者。
追逐波動性的投機資本。
但現在發生了根本不同的事情。
不是在交易論壇。
不是在加密推特辯論。
而是在退休投資組合內。
一條本不應該被跨越的界線
退休投資是全球金融系統中最保守的層面。
養老基金。
401(k) 計劃。
為幾十年而非市場週期而建立的長期財富工具。
從歷史上看,這些投資組合遵循嚴格的遊戲規則:
• 多元化股票
• 政府債券
• 指數基金
• 穩定資產配置模型
目標很簡單:
緩慢增長。受控風險。可預測的結果。
加密貨幣從來不屬於那個世界。
直到現在。
改變一切的交易所交易基金橋樑
整合不是通過交易所或錢包進行的。
它是通過一個熟悉的金融工具進行的:
交易所交易基金。
加密貨幣交易所交易基金悄悄解決了阻礙機構採用的最大障礙:
複雜性。
沒有錢包。
沒有私鑰。
沒有區塊鏈管理。
對於退休投資者來說,加密貨幣敞口突然看起來就像任何其他投資組合配置。
購買交易所交易基金。
持有它。
讓它複利增長。
為什麼這比大多數人意識到的更重要
退休系統代表地球上最大的資本池之一。
數万億美元。
但影響不僅僅是關於進入加密貨幣的資金。
這是關於這筆錢如何表現。
散戶交易者追逐動能。
機構進行季度再平
查看原文退休資本正在進入加密貨幣
十多年來,加密貨幣一直處於金融的邊緣。
早期採用者。
散戶交易者。
追逐波動性的投機資本。
但現在發生了根本不同的事情。
不是在交易論壇。
不是在加密推特辯論。
而是在退休投資組合內。
一條本不應該被跨越的界線
退休投資是全球金融系統中最保守的層面。
養老基金。
401(k) 計劃。
為幾十年而非市場週期而建立的長期財富工具。
從歷史上看,這些投資組合遵循嚴格的遊戲規則:
• 多元化股票
• 政府債券
• 指數基金
• 穩定資產配置模型
目標很簡單:
緩慢增長。受控風險。可預測的結果。
加密貨幣從來不屬於那個世界。
直到現在。
改變一切的交易所交易基金橋樑
整合不是通過交易所或錢包進行的。
它是通過一個熟悉的金融工具進行的:
交易所交易基金。
加密貨幣交易所交易基金悄悄解決了阻礙機構採用的最大障礙:
複雜性。
沒有錢包。
沒有私鑰。
沒有區塊鏈管理。
對於退休投資者來說,加密貨幣敞口突然看起來就像任何其他投資組合配置。
購買交易所交易基金。
持有它。
讓它複利增長。
為什麼這比大多數人意識到的更重要
退休系統代表地球上最大的資本池之一。
數万億美元。
但影響不僅僅是關於進入加密貨幣的資金。
這是關於這筆錢如何表現。
散戶交易者追逐動能。
機構進行季度再平


【當前用戶分享了他的交易卡片,若想瞭解更多優質交易資訊,請到 App 版查看】
- 讚賞
- 2
- 留言
- 轉發
- 分享
加載更多
加入 4000萬 人匯聚的頭部社群
⚡️ 與 4000萬 人一起參與加密貨幣熱潮討論
💬 與喜愛的頭部創作者互動
👍 查看感興趣的內容
熱門話題
查看更多12萬 熱度
4.63萬 熱度
13.43萬 熱度
14.65萬 熱度
174.09萬 熱度
熱門 Gate Fun
查看更多- 市值:$2441.37持有人數:10.00%
- 市值:$2441.37持有人數:10.00%
- 市值:$0.1持有人數:10.00%
- 市值:$2431.03持有人數:10.00%
- 市值:$0.1持有人數:10.00%
最新消息
查看更多US XRP spot ETF had net outflows of $6.08 million yesterday, SOL spot ETF had net inflows of $3.92 million
4 分鐘前
CoW DAO 回應巨鯨損失 5039 萬美元事件,承諾退還交易費用
4 分鐘前
On-chain address floating profit expands to 11.5 million USD, becoming the largest long position holder of ETH and BTC on Hyperliquid platform
5 分鐘前
昨日美国比特币现货 ETF 净流入 5408 万美元,贝莱德 IBIT 流入 4636 万美元
5 分鐘前
Yesterday, the US SOL spot ETF had a total net inflow of $3.9248 million in a single day.
6 分鐘前
置頂
Gate Booster 第 4 期:發帖瓜分 1,500 $USDT
🔹 發布 TradFi 黃金福袋原創內容,可得 15 $USDT,名額有限先到先得
🔹 本期支持 X、YouTube 發布原創內容
🔹 無需複雜操作,流程清晰透明
🔹 流程:申請成為 Booster → 領取任務 → 發布原創內容 → 回鏈登記 → 等待審核及發獎
📅 任務截止時間:03月20日16:00(UTC+8)
立即領取任務:https://www.gate.com/booster/10028?pid=allPort&ch=KTag1BmC
更多詳情:https://www.gate.com/announcements/article/50203🤖 尋找 Gate 廣場 AI 評測官!$50,000 懸賞令發布!
發帖聊 AI,獎金拿到手軟!新人首帖獎勵翻倍,單帖最高 200U!
📝 立即報名:https://www.gate.com/questionnaire/7477
1️⃣ 發帖得紅包,單帖最高 100U!
2️⃣ Top 體驗分享官:帶 #Gate广场AI测评官 聊技巧,贏國米球衣!
3️⃣ 收益率 PK 王:曬 AI 收益截圖,贏 Gate 定制運動套裝!
4️⃣ 深度好文額外加碼 30U 每篇張榜公布!
💬 來 Gate 廣場,把握行業新趨勢:https://www.gate.com/post
時間:3/12 18:00 – 3/27 24:00 (UTC+8)
詳情:https://www.gate.com/announcements/article/50206Gate 廣場|3/12 今日熱議: #原油价格上涨
🎁 帶話題或 BTC 幣對發帖,抽 5 位錦鯉送出 $2,500 仓位體驗券!
中東局勢突變:阿曼原油出口碼頭全面疏散,伊拉克石油港口停運,兩艘油輪在海灣遇襲,原油供應警報拉滿!國際能源署釋放4億桶儲備,多空對決進入白熱化。
💬 本期熱議
1️⃣ 外交局勢:伊朗開出停戰條件,美伊能否達成共識?
2️⃣ 石油博弈:你看好誰?預測下一步油價走勢。
3️⃣ 加密走勢:油價資金流向將如何影響加密市場?分享你的分析。
立刻分享觀點 👉 https://www.gate.com/post
Gate TradFi,一鍵捕捉原油機遇 👉 https://www.gate.com/tradfi
📅 3/12 15:00 - 3/14 18:00 (UTC+8)Gate 廣場內容挖礦獎勵繼續升級!無論您是創作者還是用戶,挖礦新人還是頭部作者都能贏取好禮獲得大獎。現在就進入廣場探索吧!
創作者享受最高60%創作返佣
創作者獎勵加碼1500USDT:更多新人作者能瓜分獎池!
觀眾點擊交易組件交易贏大禮!最高50GT等新春壕禮等你拿!
詳情:https://www.gate.com/announcements/article/49802