On July 22, 2026, the U.S. Dollar Index (DXY) continued its upward trend, rising for the fourth consecutive trading day and briefly trading above the 101 level intraday. Prior to that, over the previous week the DXY had been hovering around 100.76; within just a few days, the dollar completed the shift from consolidation to breakout.
This leg of dollar strength was directly triggered by two directions. One was the rapid escalation of geopolitical risk in the Middle East—U.S. forces launched attacks on Iran for the tenth consecutive night, and two oil tankers carrying Saudi crude destined for Asia changed course in the Red Sea due to threats from the Houthis. The geopolitical conflict pushed up energy prices. WTI crude rose more than 2% to a nearly five-week high, while Brent crude touched $91.99 per barrel intraday, setting a new high since June 11. Rising energy prices reignited inflation concerns, and U.S. Treasury yields moved higher as a result; the 10-year U.S. Treasury yield edged toward 4.60%, providing interest-rate level support for the dollar. The other was continued hawkishness in expectations for Fed policy—although the latest U.S. inflation data showed some cooling, remarks from Fed Chair Wosch and multiple officials still suggested that inflation pressure had not disappeared, and market expectations that the Fed would maintain high rates had not materially eased.
With both factors compounding, they formed a complete narrative for the dollar’s strength: geopolitical risk lifts oil prices → inflation expectations heat up → U.S. Treasury yields rise → the appeal of dollar-denominated assets increases. This transmission chain was fully validated on July 22.

Yen breaks below 163—why it hits the lowest level in nearly 40 years
On the other side of dollar strength is the yen’s continued breakdown. On July 22 in Tokyo’s FX market, the yen-to-U.S. dollar exchange rate briefly slid into the 163 range, refreshing the lowest level since December 1986—i.e., nearly 40 years. On the day, Japan’s Finance Minister Koyama Akizuki said that “if necessary, appropriate and decisive measures will be taken at any time.” Japan’s Chief Cabinet Secretary Nerai Shigeru also issued a similar warning. However, verbal intervention failed to provide any real support for the yen; after the officials’ remarks, the yen only held steady around 163.16.
The yen’s plunge is the result of multiple factors converging. The U.S.-Iran conflict pushes up oil prices, and since Japan is a major energy importer, its trade balance would deteriorate as a result, leading investors to sell the yen. Meanwhile, the U.S.-Japan interest-rate differential continues to widen—the Fed keeps rates high while the Bank of Japan’s pace of tightening remains slow—so carry trades continue to drive capital from the yen into the U.S. dollar. Goldman Sachs raised its USD/JPY forecast on July 6: it expected 162 in three months, 163 in six months, and 165 in one year. As of July 22, the 163 forecast had already been achieved ahead of schedule.
It is worth noting that the yen’s depreciation is not an isolated phenomenon. It creates a clear “umbrella effect” on Asian currencies—after the Chinese yuan rebounded for two consecutive trading days, it turned lower again, and both CNY and CNH fell below 6.77. The yen’s ongoing weakness is reshaping the pricing anchor across Asian FX markets.
Gold surges, touching $4,150—why it happens alongside a stronger dollar
On July 22, spot gold prices suddenly surged, briefly touching $4,161 per ounce and hitting the highest level since July 7. COMEX gold futures for the August contract jumped 1.7% to $4,144.20. Silver rose in tandem as well, with spot silver up more than 4% to above $59.
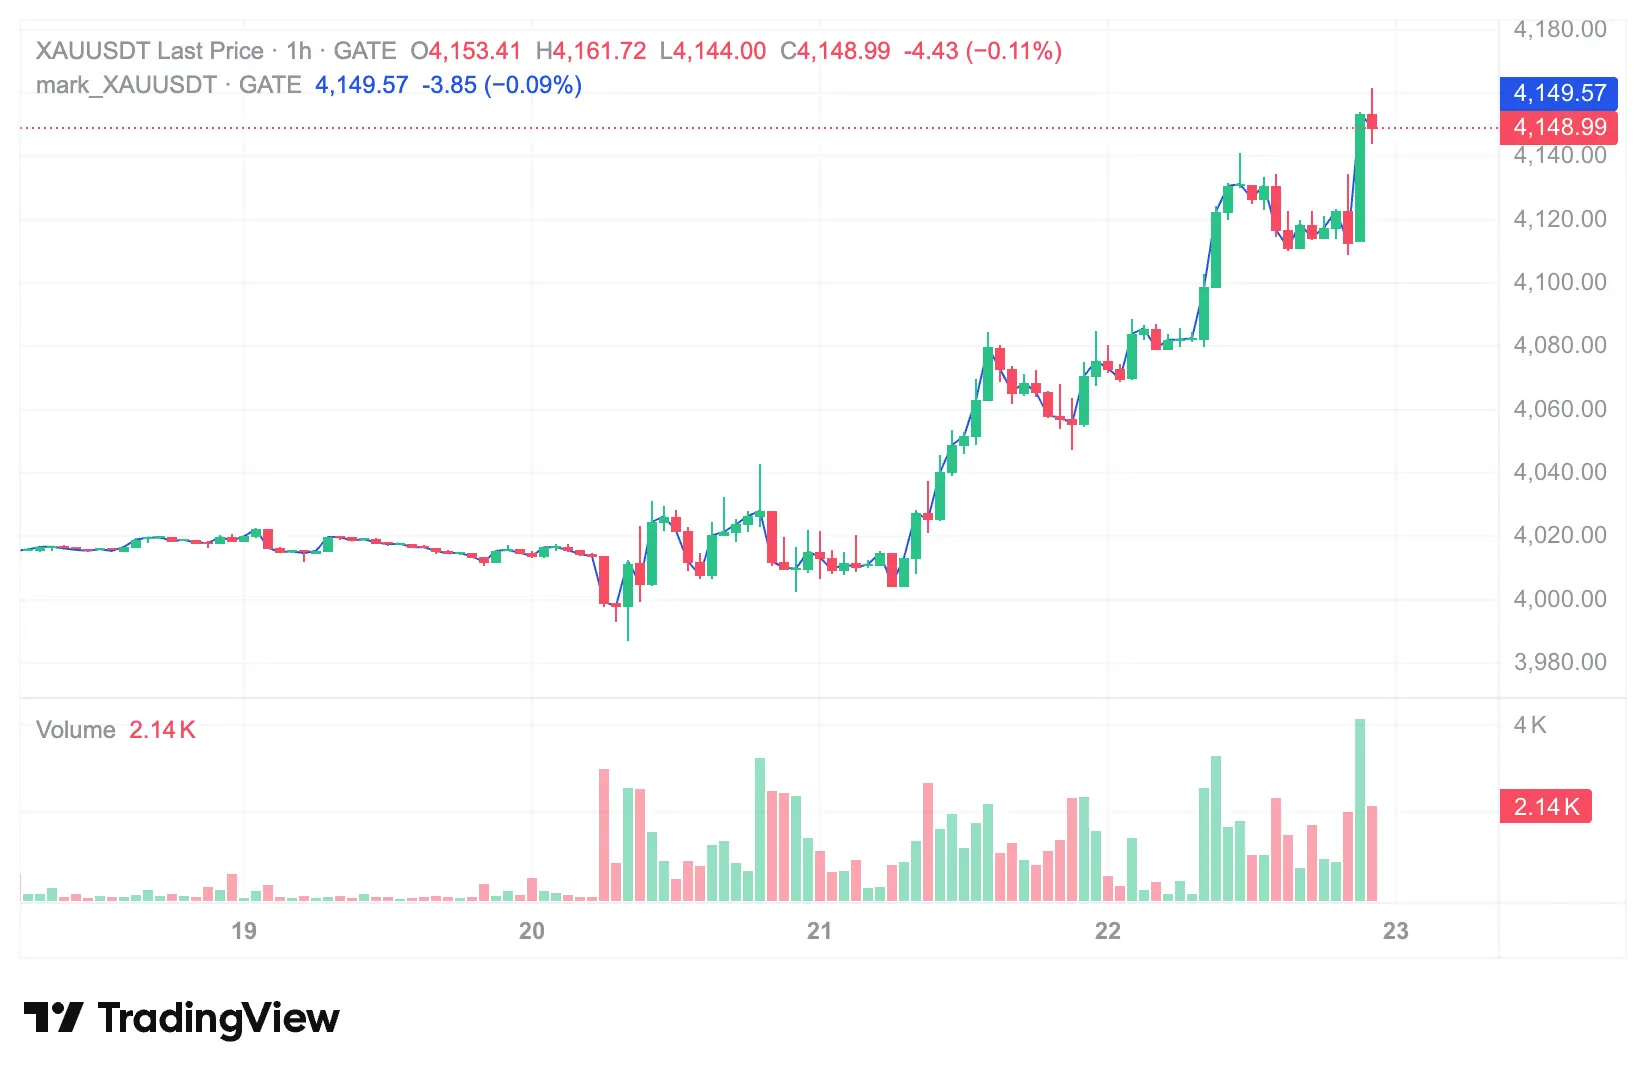
Gold rising alongside the U.S. dollar seems contradictory within the traditional pricing framework—typically, a stronger dollar suppresses gold priced in dollars. But the market’s core feature right now is that safe-haven demand generated by geopolitical risk is offsetting the suppressive effect of a strong dollar. Marex analysts pointed out that after gold broke through a short-term downtrend line, it received technical buying support. The deeper driver is that the Middle East conflict is materially disrupting shipping to two of the world’s most critical energy chokepoints. When uncertainty about energy supply rises to a certain level, the appeal of gold as the ultimate safe-haven asset can outweigh the relative-price effect versus exchange rates.
In addition, gold’s earlier pullback itself also provided an entry window for technical buyers. Last week, gold experienced its steepest one-week decline since early June, and some investors viewed it as an opportunity for “value buying.” This logic was concentratedly released on July 22.
Bitcoin tops $66,000—how are crypto assets priced in this macro resonance?
Against the backdrop of synchronized moves in the dollar, the yen, and gold, the crypto market reacted as well. As of July 22, 2026, according to Gate market data, Bitcoin was temporarily at $65,751.2, while Ethereum was temporarily at $1,939.65. During the day, Bitcoin briefly touched $66,956, refreshing its two-week high.
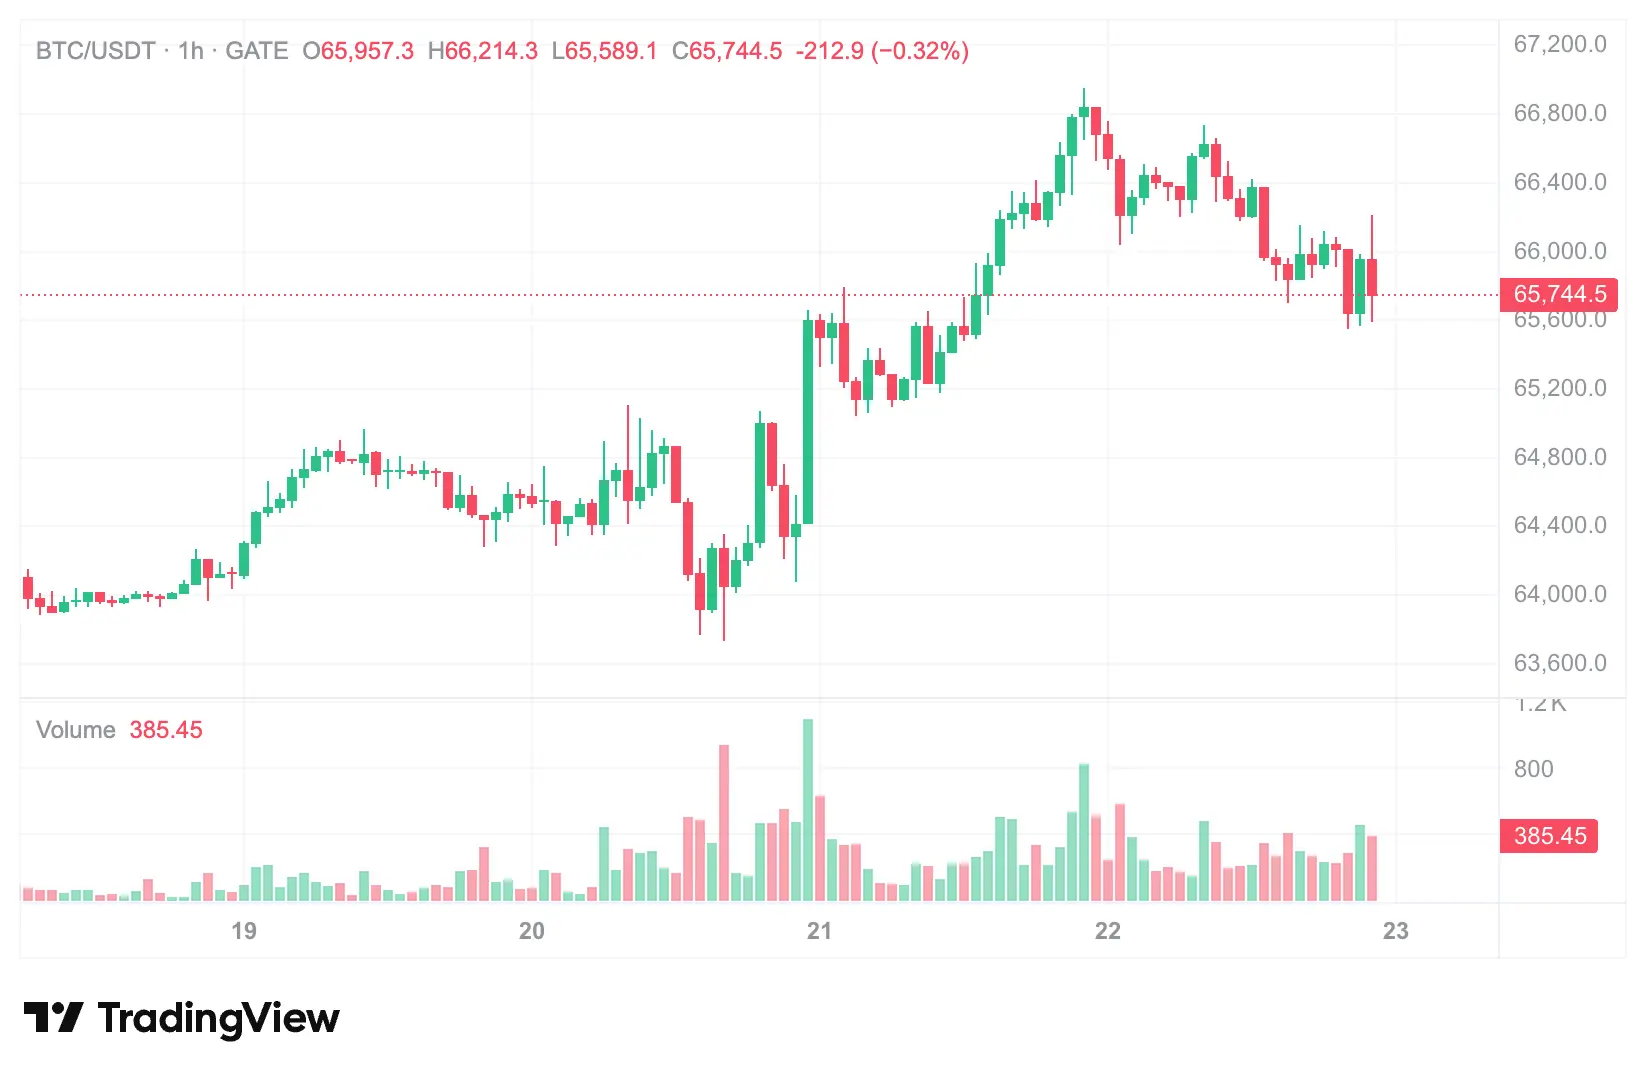
Bitcoin’s rise is not an isolated event. U.S. stocks closed broadly higher on Tuesday: the S&P 500 rose 0.89%, and the Nasdaq climbed 1.29%. A rebound in semiconductor and AI-related stocks lifted overall risk appetite, and the crypto market benefited in sync. The Fear and Greed Index moved up from “Extreme Fear” at 25 to “Fear” at 33, indicating that market sentiment is repairing.
However, the pricing logic for Bitcoin in this macro resonance is far more complex than it appears on the surface. It is being pulled in two directions at the same time. On the one hand, rising geopolitical risk in the Middle East should theoretically strengthen the safe-haven narrative of Bitcoin as “digital gold.” On the other hand, a stronger dollar and higher real yields typically mean valuation pressure on risk assets. The market performance on July 22 showed that Bitcoin chose to rise alongside risk assets (U.S. stocks) rather than simply replicate a pure safe-haven path like gold. This choice itself reveals Bitcoin’s dual attributes in the current macro environment—it has a certain degree of safe-haven characteristics, yet is also deeply affected by global liquidity conditions and risk appetite.
The strong negative correlation between Bitcoin and the USD/JPY exchange rate—what signal does it send?
A quantitative perspective offers clearer clues. Over the past 52 weeks, Bitcoin and the USD/JPY currency pair have shown a significant negative correlation, with the correlation coefficient reaching -0.90. That means when the USD/JPY appreciates (the yen depreciates), Bitcoin tends to fall; and vice versa.
Behind this high negative correlation lies a shared macro driver—when the dollar strengthens and the U.S.-Japan interest-rate differential widens, global financial conditions tighten, capital returns to dollar assets, and the appeal of speculative assets declines. The yen, as the primary funding currency for global carry trades, weakening itself reflects the trend of capital flowing from low-interest currencies toward high-yielding dollars. As a high-beta risk asset, Bitcoin is under pressure in this liquidity “siphon” process.
But on July 22, the data showed an interesting change: while USD/JPY broke above 163, Bitcoin did not fall—instead, it rose to above $66,000. Does this mean the negative correlation between Bitcoin and USD/JPY is loosening? A more reasonable explanation is that safe-haven demand driven by geopolitical risk (which benefits gold and also partially benefits Bitcoin) temporarily outweighed the liquidity suppression brought by the strong dollar (which is bearish for Bitcoin). The tug-of-war between these two forces determines Bitcoin’s specific pricing at each macro point.
Divergence between gold and Bitcoin—does it mean the “digital gold” narrative is being tested?
On July 22, gold and Bitcoin both rose, but their magnitude and driving logic differed. Gold rose 1.6% to $4,139, driven more by geopolitical safe-haven demand and technical buying; Bitcoin rose by about 1.6% to above $66,600, driven more by a rebound in risk appetite in U.S. stocks.
This difference is not accidental. Data from early 2026 to date shows gold is up about 9%, the Nasdaq is up 13%, while Bitcoin is down about 11%. Although the linkage between Bitcoin and gold has strengthened somewhat after institutional capital inflows, the core of how they are priced still has fundamental differences: gold’s rise more reflects structural demand to “de-dollarize” and hedge against geopolitics; Bitcoin’s performance is more closely tied to global liquidity and risk appetite for technology stocks.
This does not mean the “digital gold” narrative has failed. Instead, it indicates that the market needs a more precise understanding of Bitcoin’s macro attributes. Bitcoin’s fixed supply cap and global liquidity characteristics give it a certain value-store function when government debt, inflation, and FX volatility rise. But in terms of short-term pricing, it remains highly exposed to fluctuations in dollar liquidity and risk appetite. The divergence between gold and Bitcoin essentially reflects where each sits on the “safe-haven asset” spectrum—gold is closer to the pure safe-haven end, while Bitcoin is closer to the risk-asset end.
From the U.S. dollar and yen to gold and Bitcoin—what is the core main line of global asset re-pricing?
If we place the above assets onto the same map, a clear main line emerges: geopolitical risk is redefining the weightings that govern the pricing of global assets.
Middle East conflict pushes up energy prices → inflation expectations heat up → U.S. Treasury yields and the dollar strengthen → yen faces pressure → gold rises on safe-haven demand → Bitcoin finds equilibrium in the tug-of-war between risk appetite and safe-haven narratives. This chain is not a linear one-way transmission, but a complex system involving multiple assets and multiple interacting factors.
With the DXY above 101, the yen breaking below 163, and gold touching $4,140—these three sets of numbers share one common point: they have all exceeded most institutional benchmarks’ expectations at the beginning of the year. This shows that what the market is experiencing is not an ordinary cyclical fluctuation, but a structural repricing reset. The geopolitical-risk premium is being re-evaluated; the link between energy security and inflation is being re-priced; and the correlation structure across different asset classes is being re-calibrated.
For crypto assets, this means the weight of macro factors in their pricing models will continue to rise. Bitcoin’s -0.90 correlation with USD/JPY has already shown that the next policy decision by the Bank of Japan and the Fed’s rate path are just as important as on-chain data or ETF fund flows. The crypto market can no longer interpret itself from a perspective “independent of macro.”
Triple macro signals resonating—what should crypto investors pay attention to?
The triple dislocations in the dollar, the yen, and gold give crypto investors several dimensions worth tracking continuously.
First, the USD/JPY 163 level. If the yen further depreciates to 164 or even 165, the probability that Japanese authorities implement actual FX intervention would rise significantly. Historical experience suggests that such intervention may temporarily weaken the dollar and provide risk assets—including Bitcoin—with a brief breathing space.
Second, the future direction of oil prices. After oil breaks above $90, its impact on inflation expectations and the Fed’s policy path will become more pronounced. There is an indirect but real transmission relationship between liquidity pressures in the crypto market and oil prices.
Third, the Fed’s July policy meeting. The market is watching the remarks from Chair Wosch and the interest-rate decision. Any signals about the timing of rate cuts or inflation assessments could trigger sharp swings in DXY, which would then transmit into the crypto market.
Fourth, the evolution of the correlation between gold and Bitcoin. If gold continues to rise while Bitcoin fails to keep up, it may mean the market is still classifying Bitcoin as a risk asset rather than a safe-haven asset; if their correlation strengthens again, it may indicate that the “digital gold” narrative is gaining broader market recognition.
FAQ
Q: Why does a stronger U.S. Dollar Index usually hurt Bitcoin?
A stronger U.S. dollar usually means global financial conditions tighten, real interest rates rise, capital flows back into dollar assets, and the appeal of speculative risk assets declines. As a high-beta asset, Bitcoin often faces pressure during this process.
Q: What does the yen breaking below 163 mean for the crypto market?
Yen depreciation reflects the widening U.S.-Japan interest-rate differential and the activity of carry trades—essentially a process of global liquidity concentrating into the U.S. dollar. Bitcoin shows a strong negative correlation of -0.90 with USD/JPY; the weaker the yen, the stronger the macro headwind Bitcoin typically faces. But short-term factors such as geopolitical risk may temporarily offset this effect.
Q: Gold surges but Bitcoin’s gain is limited—does that mean Bitcoin isn’t “digital gold”?
They are positioned differently along the safe-haven spectrum—gold is closer to the pure safe-haven end, while Bitcoin is closer to the risk-asset end. Bitcoin’s fixed supply cap gives it value-storage potential in the long run, but in the short term it remains highly exposed to fluctuations in global liquidity and risk appetite.
Q: What is the most worth-watching indicator in this macro resonance?
The USD/JPY exchange rate, WTI crude oil price, the 10-year U.S. Treasury yield, and changes in the wording of the Fed policy meeting—these are the macro indicators with the strongest transmission effect to the crypto market right now.
Q: How would Japan’s authorities intervening in FX markets affect the crypto market?
If Japan’s authorities implement actual FX intervention to support the yen, it could temporarily weaken the dollar, providing risk assets including Bitcoin with some incremental liquidity relief. However, the effect of intervention is usually short-lived; the medium- to long-term trend still depends on interest rates and inflation fundamentals.


