Date: Thu, Dec 18, 2025 | 11:00 AM GMT
The broader cryptocurrency market has been experiencing choppy price action over the past several weeks, a phase that began after the sharp sell-off on October 10. That correction dragged Ethereum (ETH) down by nearly 27% over the last 60 days, keeping sustained pressure on major altcoins, including DEX token** Aster ($ASTER).**
ASTER has fallen more than 25% over a week alone, extending its 60-day decline to roughly 42%. While the short-term trend remains firmly bearish, a closer look at the chart suggests something more constructive may be developing beneath the surface.
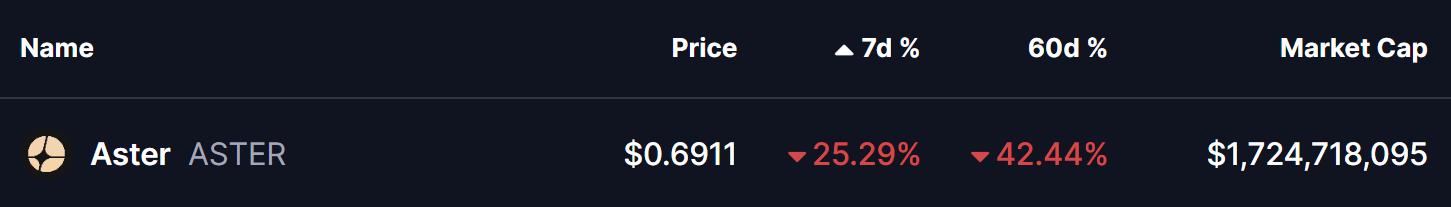
Source: Coinmarketcap
Interestingly, ASTER’s current structure is beginning to resemble the bottoming pattern previously seen in Hyperliquid (HYPE), a setup that ultimately led to a powerful trend reversal earlier this year.
ASTER Mirrors HYPE’s Bottoming Path
Aster appears to be tracing a price structure that closely aligns with HYPE’s April 2025 fractal — a period that preceded a multi-hundred-percent rally.
HYPE’s move began with a sharp correction following its all-time high. That decline eventually forced price below the 50-day moving average, confirming a shift in momentum. Rather than collapsing further in a straight line, HYPE transitioned into a rounding bottom structure, reflecting a gradual slowdown in selling pressure and the early stages of accumulation.
The token ultimately found its floor after a steep 73% drawdown from its peak, a point that marked clear seller exhaustion. From there, momentum shifted decisively. A clean reclaim of the 50-day moving average acted as the key confirmation signal, setting the stage for a breakout from the rounding bottom. What followed was a powerful 434% rally, making it one of HYPE’s most notable reversals of the year.
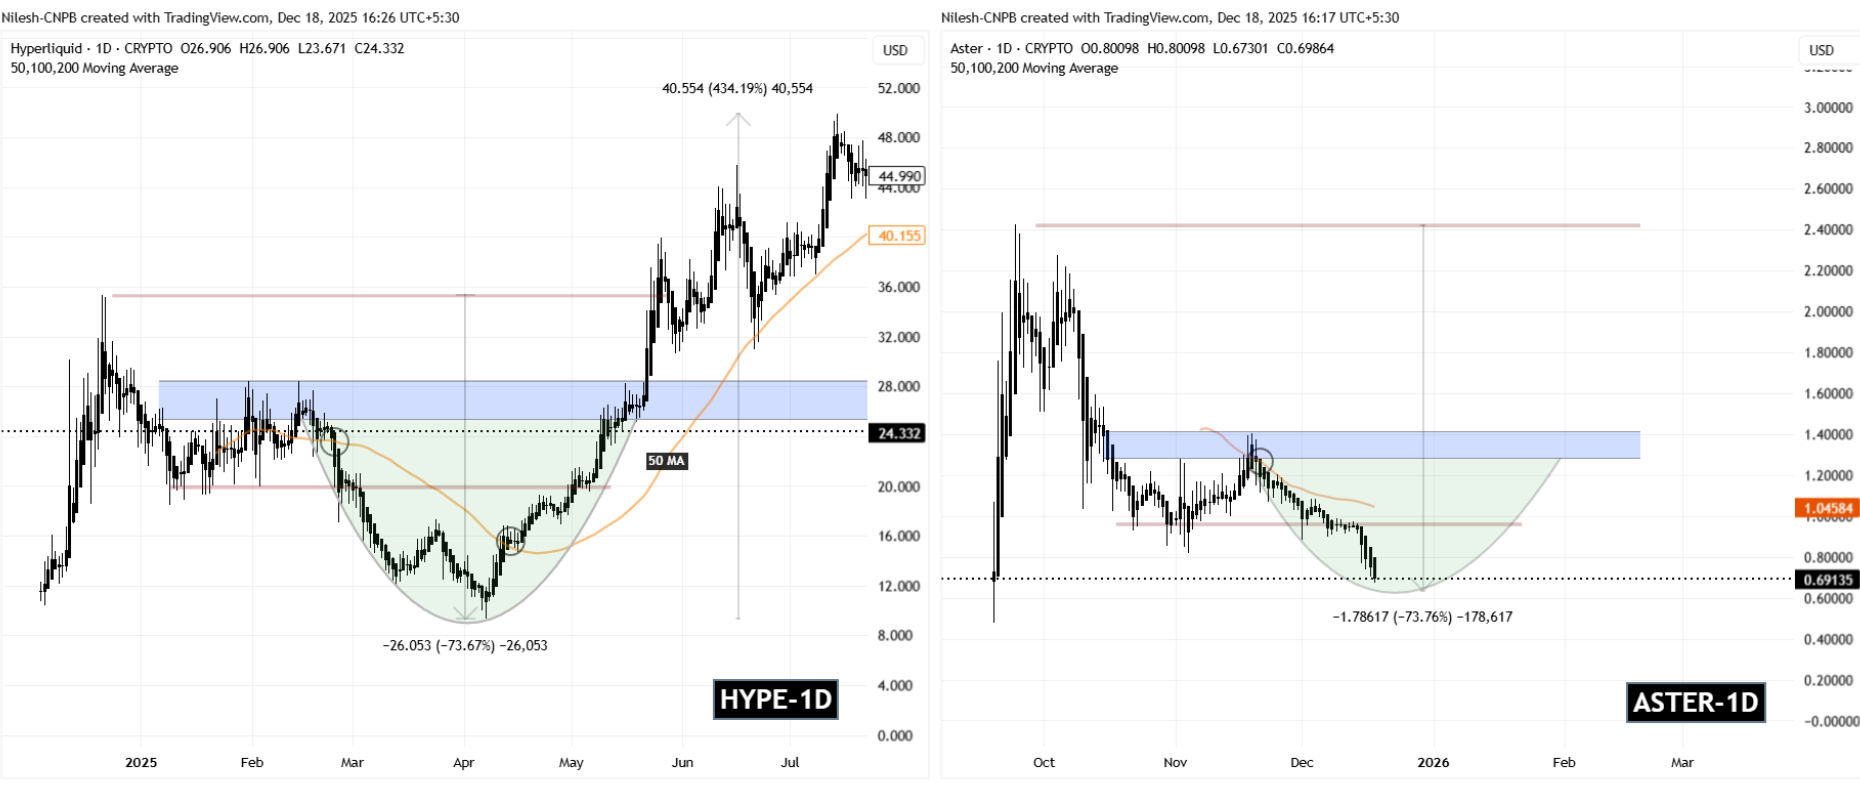
HYPE and ASTER Fractal Chart/Coinsprobe (Source: Tradingview)
Now, ASTER appears to be walking a similar road.
After topping out near its all-time high around $2.42, ASTER entered a prolonged corrective phase and slipped below its 50-day moving average. The chart now shows price carving out a potential rounding bottom, with the $1.30–$1.40 region acting as a key neckline zone. This structure closely mirrors HYPE’s pre-bottom behavior, as highlighted in the comparative chart.
What’s Next for ASTER?
If this fractal continues to unfold, ASTER may still face some near-term downside pressure. A deeper move toward the $0.60 area would complete a decline of roughly 73% from its all-time high — the same magnitude of correction where HYPE previously established its bottom.
From a bullish standpoint, the first meaningful signal to watch is a reclaim of the 50-day moving average, currently hovering near the $1.04 level. A sustained move above this zone would suggest that bearish momentum is weakening. If followed by a decisive breakout above the neckline resistance, ASTER could transition into a broader recovery phase, potentially echoing the type of upside expansion HYPE experienced after confirming its reversal.
Key Risk Note
While fractal similarities can offer valuable context, they do not guarantee identical outcomes. Market conditions, liquidity dynamics, and broader sentiment can differ significantly from one asset to another. Confirmation remains critical, and downside invalidation levels should be respected if the structure fails to hold.
For now, ASTER appears to be approaching a critical inflection point. Whether this evolving structure turns into a confirmed bottom or merely a pause before further weakness will depend on how price behaves around its moving averages and key support zones in the days ahead.
Disclaimer: The views and analysis presented in this article are for informational purposes only and reflect the author’s perspective, not financial advice. Technical patterns and indicators discussed are subject to market volatility and may or may not yield the anticipated results. Investors are advised to exercise caution, conduct independent research, and make decisions aligned with their individual risk tolerance.
Disclaimer: The information on this page may come from third parties and does not represent the views or opinions of Gate. The content displayed on this page is for reference only and does not constitute any financial, investment, or legal advice. Gate does not guarantee the accuracy or completeness of the information and shall not be liable for any losses arising from the use of this information. Virtual asset investments carry high risks and are subject to significant price volatility. You may lose all of your invested principal. Please fully understand the relevant risks and make prudent decisions based on your own financial situation and risk tolerance. For details, please refer to
Disclaimer.
Related Articles
AHR999 Index Falls Below 0.45 for First Time in 837 Days
Gate News bot message, The AHR999 Index has dropped below 0.45, marking the first occurrence in 837 days. This level was last observed in February 2026. Prior to that, the index reached this zone in October 2023, preceding the price movement from $28K to $72K. The source notes this is not a buy sign
GateNews26m ago
XRP Supply Shift: Whales Add 200 Million Tokens as Price Eyes $1.50 - U.Today
XRP has seen a significant increase in whale activity, with 200 million XRP bought recently, while network activity and wallet numbers reach new highs. A "golden cross" signals potential price rises, as the SEC clarifies crypto asset regulations.
UToday2h ago
Bitcoin Breaks Below $71,000, Ethereum Falls Below $2,200! Nearly $300 Million in Liquidations Across the Network in 4 Hours, Inflation, Conflict, and Political Deadlock "Triple Kill" Crypto Market
The crypto market experienced a sharp decline on the evening of the 18th, with Bitcoin falling below $71,000 and Ethereum dropping to $2,200. The causes include U.S. PPI data exceeding expectations, which reduced the likelihood of Federal Reserve rate cuts; escalating Middle East conflicts increasing geopolitical risks; and gridlock in the U.S. Congress over crypto regulations. Market sentiment was severely damaged, with 110,000 people liquidated in just 4 hours, resulting in losses of $300 million.
動區BlockTempo3h ago
Here’s Where Gold Price Could Go After the FOMC Decision
Gold is in a bearish trend, forming a waterfall pattern with lower highs and lows. Watch the 4905 level; a break could lead to a drop toward 4841. Upcoming FOMC announcements may cause volatility, impacting price movements.
CaptainAltcoin4h ago
A Certain CEX Survey: 74% of Institutions Expect Cryptocurrency Market to Rebound in the Next 12 Months, Allocation Willingness Continues to Strengthen
Despite the crypto market's pullback since last year, the latest survey shows that institutional investor confidence remains solid, with 73% planning to increase digital asset allocation by 2026, and 74% expecting market recovery over the next 12 months. Most institutions prefer to invest through regulated instruments while focusing on regulatory clarity and risk management.
GateNews4h ago
