Hyperliquid (HYPE) is trading around the 25 USD mark at the time of writing on Monday, thus maintaining an increase of about 3% compared to the previous session. This perpetual contract exchange recorded a short term bounce back in the number of active users, although the total fees collected over the week have dropped to the lowest level since the beginning of the month. In the derivatives market, data shows a return of retail money flow, reflected in the increase in open positions on HYPE futures contracts, while the funding rate is leaning positively, reflecting investors' bullish expectations.
However, the technical picture of Hyperliquid is still not really clear. Selling pressure is showing signs of weakening, but the price bounce back may face many important resistance levels in the short term.
The interest of individual investors is increasing along with the bounce back of users.
Data from Artemis recorded the number of daily active users soaring to 13,800 on Friday, compared to 9,100 on December 6th. This development indicates signs of bounce back in the short term, although it still lies within the context of a prolonged declining trend. In the scenario where the cryptocurrency market stabilizes again soon, this recovery momentum could be reinforced, thereby promoting sustainable growth in user numbers and demand for the Hyperliquid platform.
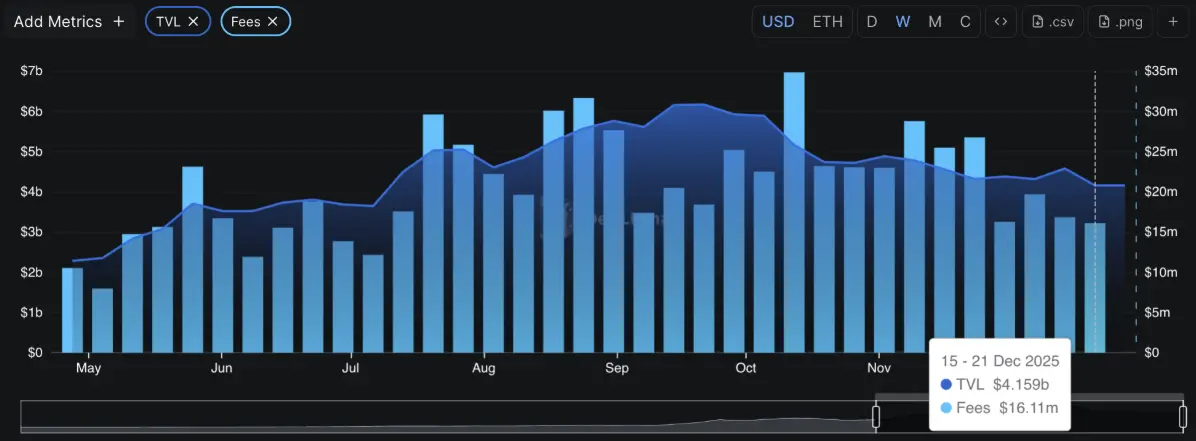
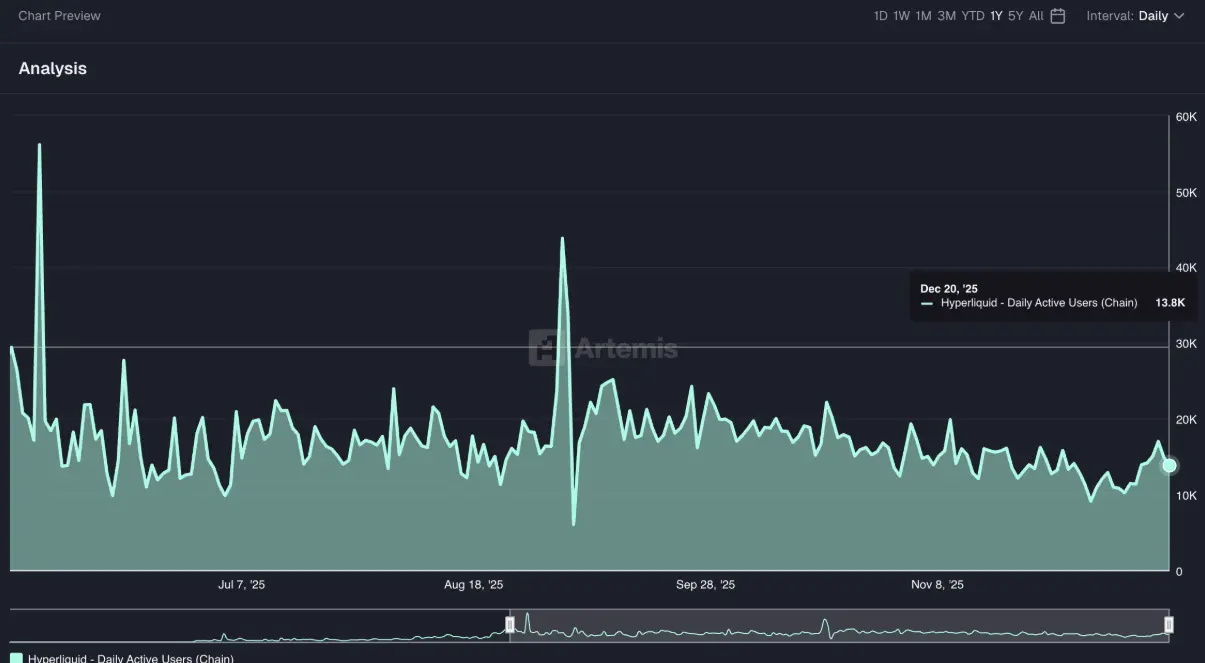 User activity data of Hyperliquid | Source: ArtemisOn the contrary, data from DeFiLlama shows that total transaction fees collected in the previous week only reached 16.11 million USD — the lowest weekly figure since the beginning of December. This figure reflects that, although user activity shows signs of recovery, the market's willingness to accept risk remains quite cautious, resulting in generated fees not being commensurate.
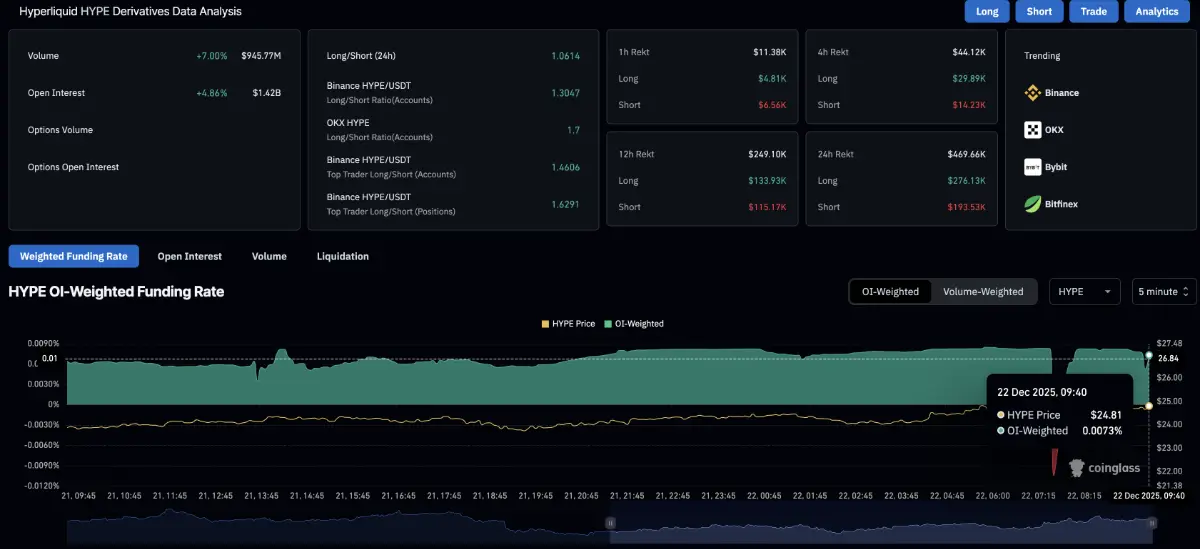
 Data on transaction fees of Hyperliquid | Source: DeFiLlamaNotably, in the derivatives market, the interest of retail investors in the HYPE token is increasing significantly. According to CoinGlass, the open interest (OI) of HYPE futures contracts has reached 1.42 billion USD, up 4.86% in just 24 hours. At the same time, the funding rate remains at a positive 0.0073%, indicating that the bulls are in control, as traders are willing to pay fees to maintain Long positions, reflecting more optimistic expectations in the short term.
 Derivative data HYPE | Source: CoinGlass## Hyperliquid bounces back as selling pressure weakens
Hyperliquid (HYPE) is currently trading around the 25 USD mark at the time of writing on Monday, indicating a sideways accumulation state after a consecutive fall lasting 5 sessions last week. At the moment, the nearest resistance zone is identified at the Pivot S1 level around 26.03 USD, above which is the resistance trendline connecting the two peaks formed on 30/10 and 4/12, respectively around the 28.00 USD area.
In a positive scenario, if HYPE breaks decisively above the 28 USD threshold, the bullish momentum could be extended towards the 50-day exponential moving average (EMA) at 32.36 USD – an important technical milestone that could serve as a check on the short term trend.
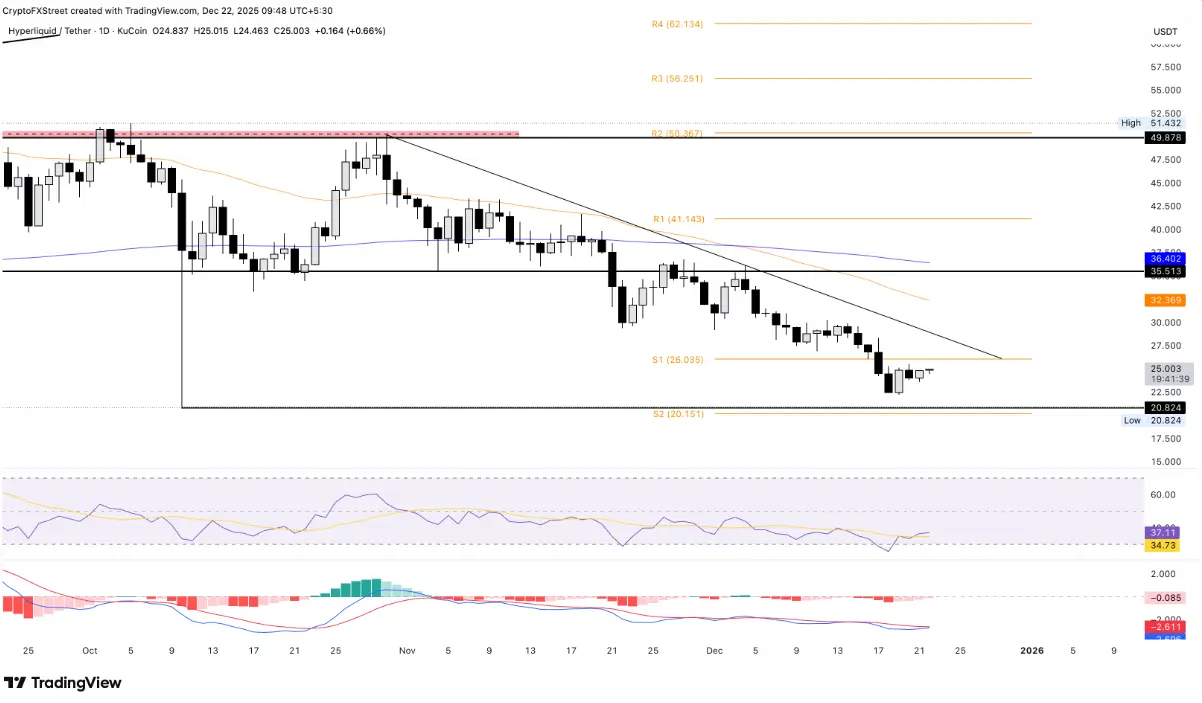 HYPE/USDT daily chart | Source: TradingViewThe technical signals on the daily timeframe are showing a noticeable weakening of selling pressure. The RSI is currently at 37 and trending upwards, reflecting the price gradually escaping the oversold zone. This development indicates that the previous selling force shows signs of exhaustion, thereby opening up the possibility of forming a short-term bounce back.
At the same time, the MACD line is approaching the signal line, implying the possibility of a bullish crossover in the near future. If confirmed, this will be a signal reinforcing the improvement of trend momentum.
On the contrary, in the case that selling pressure returns, HYPE may retreat to the important support zone ranging from the low of 10/10 to the Pivot S2 point, corresponding to the price range of 20.82 – 20.15 USD, where it is expected to trigger defensive buying pressure.
SN_Nour
Disclaimer: The information on this page may come from third parties and does not represent the views or opinions of Gate. The content displayed on this page is for reference only and does not constitute any financial, investment, or legal advice. Gate does not guarantee the accuracy or completeness of the information and shall not be liable for any losses arising from the use of this information. Virtual asset investments carry high risks and are subject to significant price volatility. You may lose all of your invested principal. Please fully understand the relevant risks and make prudent decisions based on your own financial situation and risk tolerance. For details, please refer to
Disclaimer.
Related Articles
Why is Bitcoin down today? Saudi petrochemical industrial facilities were hit, and Trump issued an ultimatum to Iran
Bitcoin (BTC) fell to about $68,800 on April 7, driven by geopolitical risks in the Middle East and Trump’s hardline remarks toward Iran. The Saudi explosion incident boosted global safe-haven sentiment, and technical indicators showed overbought pressure. In addition, Bitcoin’s key support lies in the $67,500 to $69,500 range; if it breaks below $66,000, the risk will widen to $64,000. Several analysts believe the pullback is more like a healthy correction rather than a trend reversal.
MarketWhisper12m ago
The Crypto Fear and Greed Index fell to 11 today, and the market is still in an extreme state of fear
Gate News, April 7: According to Alternative.me data, the Crypto Fear and Greed Index today dropped to 11, down further from yesterday’s 13. The market remains in an “extreme fear” state.
GateNews1h ago
Can Trump’s ultimatum stop the ceasefire? Oil prices are rising, and Bitcoin has fallen to 68K
The market is concerned about the impending military action, causing U.S. crude oil (WTI) prices to break above $112 per barrel and the stock market to rise slightly. Bitcoin briefly climbed to $70,351, then subsequently fell to $68K, and Ether also dropped below $2,100. Investors are watching the Federal Reserve meeting minutes and the inflation indicator PCE data, as the economic outlook remains unclear.
ChainNewsAbmedia1h ago
BTC 15-minute drop of 0.62%: whale capital inflows into exchanges spark short-term sell pressure
2026-04-06 22:45 to 23:00 (UTC), BTC fell 0.62% in short-term trading. The price fluctuated between 68812.1 and 69240.0 USDT, with an amplitude of 0.62%. Trading volume rose in sync during this period, market attention increased noticeably, volatility risk rose, and short-term investors’ sentiment turned cautious.
The main driving force behind this unusual move is that on-chain data shows whales holding large amounts of BTC are concentrating funds to exchanges. Within 10 minutes, the total amount of funds transferred was about $420,000; within 24 hours, it reached 867.28 BTC, even higher. Then
GateNews2h ago
BTC drops below 69,000 USDT, and the 24-hour gain narrows to 1.25%
Gate News update: On April 6, market data shows that BTC has broken below 69,000 USDT, currently trading at 68,979.5 USDT. The 24-hour gain has narrowed to 1.25%.
GateNews2h ago
Bitcoin Eyes $80,000 Milestone As Geopolitical Tensions in the Strait of Hormuz Reach a Boiling P...
The crypto market currently is at a pivotal point where technical momentum meets intense global uncertainty. After being stuck in a holding pattern for many weeks, BTC now appears poised to break out again as geopolitical narratives shift and additional volatility is expected. Top crypto analyst
BlockChainReporter3h ago
