Date: Thu, Dec 18, 2025 | 07:10 AM GMT
The broader cryptocurrency market has been experiencing choppy price action over the past several weeks, a phase that began after the sharp sell-off on October 10. That correction dragged Ethereum (ETH) down by nearly 22% over the last 60 days, keeping pressure firmly on major altcoins — including Avalanche (AVAX).
AVAX has slipped more than 12% over the past week alone, extending its 60-day decline to over 41%. While the short-term trend remains weak, a closer look at the higher-timeframe chart suggests that the sell-off may be approaching an area where downside momentum starts to fade.
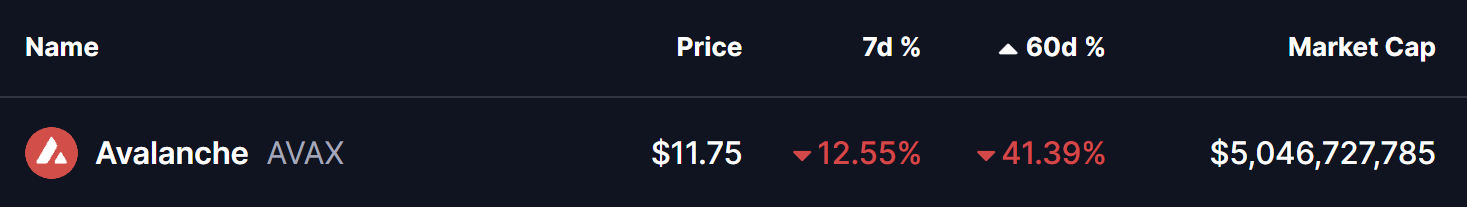
Source: Coinmarketcap
Falling Wedge Pattern in Play
On the weekly chart, AVAX continues to trade inside a well-defined falling wedge pattern. This structure has been guiding price action since early 2024 and is characterized by lower highs and lower lows that gradually compress into a narrowing range. Historically, falling wedges often reflect slowing selling pressure rather than aggressive distribution.
As shown on the chart, the latest decline has pushed AVAX directly into the lower boundary of this wedge, near the $11.64 region. This zone has acted as a critical demand area in the past, repeatedly attracting buyers and triggering short-term rebounds. Once again, price is reacting near this level, suggesting that sellers may be losing strength as AVAX presses into long-term support.
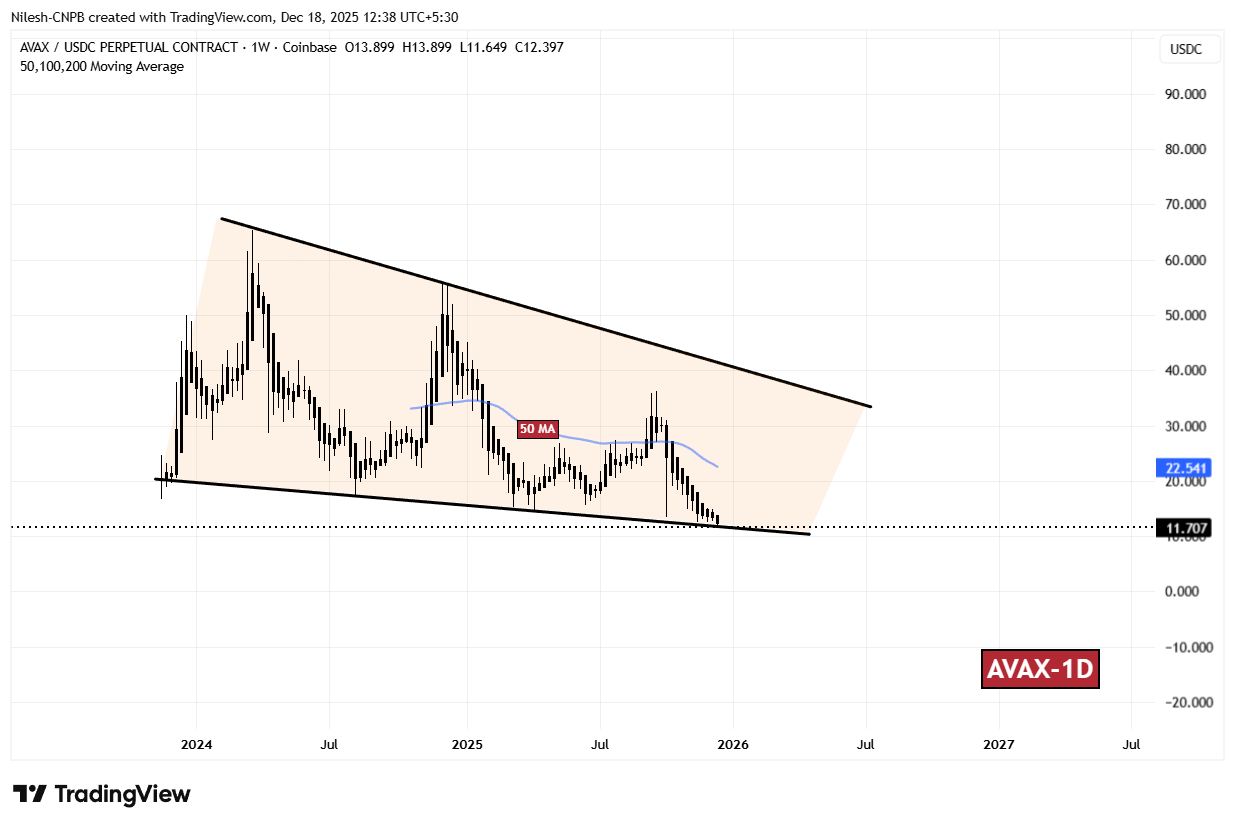
AVAX Weekly Chart/Coinsprobe (Source: Tradingview)
The repeated defenses of the wedge’s lower trendline, combined with shrinking downside follow-through, point to growing indecision rather than panic selling. This behavior often precedes a stabilization phase or a relief bounce.
What’s Next for AVAX?
If AVAX continues to hold above the wedge floor, the focus will shift to whether buyers can reclaim key overhead levels. The first major hurdle sits at the 50-week moving average, currently near $22.54. This level has consistently acted as dynamic resistance during prior recovery attempts and remains a key marker for any trend change.
A sustained move above this moving average would strengthen the bullish case and potentially open the door for a push toward the upper boundary of the falling wedge. Reaching that zone would signal a meaningful shift in market structure and sentiment.
That said, the setup remains conditional. A decisive weekly close below the wedge’s lower boundary would invalidate the pattern and expose AVAX to further downside risk, with the next notable support area emerging near the $9.00 level.
For now, AVAX sits at a technically important crossroads. While broader market conditions remain fragile, the compression within this falling wedge suggests that a larger move may be approaching — with the coming weeks likely to determine whether this support zone becomes a base for recovery or a stepping stone to deeper losses.
Disclaimer: The views and analysis presented in this article are for informational purposes only and reflect the author’s perspective, not financial advice. Technical patterns and indicators discussed are subject to market volatility and may or may not yield the anticipated results. Investors are advised to exercise caution, conduct independent research, and make decisions aligned with their individual risk tolerance.
Disclaimer: The information on this page may come from third parties and does not represent the views or opinions of Gate. The content displayed on this page is for reference only and does not constitute any financial, investment, or legal advice. Gate does not guarantee the accuracy or completeness of the information and shall not be liable for any losses arising from the use of this information. Virtual asset investments carry high risks and are subject to significant price volatility. You may lose all of your invested principal. Please fully understand the relevant risks and make prudent decisions based on your own financial situation and risk tolerance. For details, please refer to
Disclaimer.
Related Articles
Here’s the Shiba Inu (SHIB) Price if Burn Rate Collapse Triggers a Supply Shock
Shiba Inu is experiencing dual narratives: it's now recognized as a digital commodity, yet faces pressure from a high exchange influx and a drastic 98% drop in burn rate. While the price remains steady at $0.00000609, future movements depend on increased burn activity and market demand.
CaptainAltcoin1h ago
Markets Down 25%, Sentiment Up 80%: 5 Macro Catalysts—From Trade Easing to Fed Printing that Could Ignite the Next Explosive Surge.
Market sentiment is rising despite a 25% decline, signaling early accumulation behavior.
Macro factors like easing policy and weaker dollar support altcoin recovery potential.
Infrastructure and narrative-driven tokens may lead the next market phase.
The crypto market has plunged into a
CryptoNewsLand2h ago
Solana Price Holds Near $80 as Analysts Split on Next Move
Key Insights:
Solana trades near $80 under pressure, with persistent lower highs and weak recovery attempts reinforcing a clear short-term bearish market structure.
Analysts identify the $75 to $45 range as a key accumulation zone, supported by historical demand levels and long-term
CryptoNewsLand3h ago
ADA Price Weakens Under Resistance While Large Wallets Accumulate
Key Insights:
Cardano trades below all major moving averages, reinforcing bearish pressure while price struggles to reclaim even short-term resistance levels across multiple timeframes.
Whale wallets holding large ADA balances have steadily accumulated since February, reaching their
CryptoNewsLand4h ago
Cardano Price Near $0.245 Level as Market Momentum Weakens
Cardano's price is stabilizing around the $0.245 support level amid market consolidation and declining momentum. The inability to break resistance at $0.268 raises concerns about upward strength. Meanwhile, development of the new node version 10.7.0 is in testing, promising enhancements for the ecosystem.
CryptoNewsLand4h ago
Dogecoin Near Key Breakout Zone as X Money Buzz Builds
Key Insights:
Dogecoin volatility has tightened significantly, with Bollinger Bands compressing to yearly lows, indicating a sharp price move could emerge within days.
Rising futures volume and strong long positioning show traders anticipate upside, although repeated liquidations highlight r
CryptoFrontNews4h ago
