Date: Sun, Dec 21 2025 | 10:26 AM GMT
The broader cryptocurrency market has continued to struggle with uneven and choppy price action over the past several weeks, a phase that began after the sharp sell-off on October 10. That correction pushed Ethereum (ETH) lower by nearly 26% over the last 60 days, keeping sustained pressure across the altcoin market. **Stellar (XLM) **has been no exception, remaining under selling pressure as risk appetite across the sector stays muted.
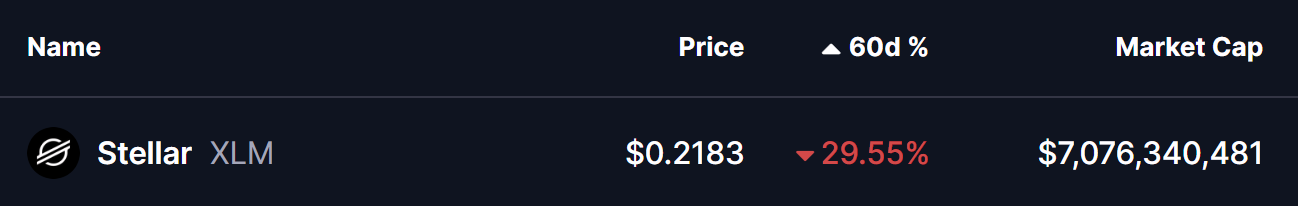
**XLM **is down more than 29% over the past two months, but beneath the surface, the weekly chart is starting to reveal a technical structure that could lay the groundwork for a potential rebound if key levels continue to hold.
Source: Coinmarketcap
Descending Triangle Structure Comes Into Focus
On the weekly timeframe, XLM has been trading within a large descending triangle formation. This pattern is defined by a series of lower highs pressing against a relatively flat support base, reflecting consistent selling pressure from the top while buyers defend the same demand zone below. While descending triangles are often viewed as bearish continuation structures, repeated defenses of the base can also precede sharp upside reactions, particularly when broader market sentiment is already pessimistic.
The chart shows XLM once again pulling back into the critical $0.20–$0.22 support region. This zone has acted as a reliable demand area throughout the year, with each visit producing long lower wicks and swift reactions from buyers. These candle structures suggest that accumulation is taking place, even as price continues to respect the descending trendline from above. Despite months of pressure, sellers have so far been unable to force a decisive breakdown below this floor.
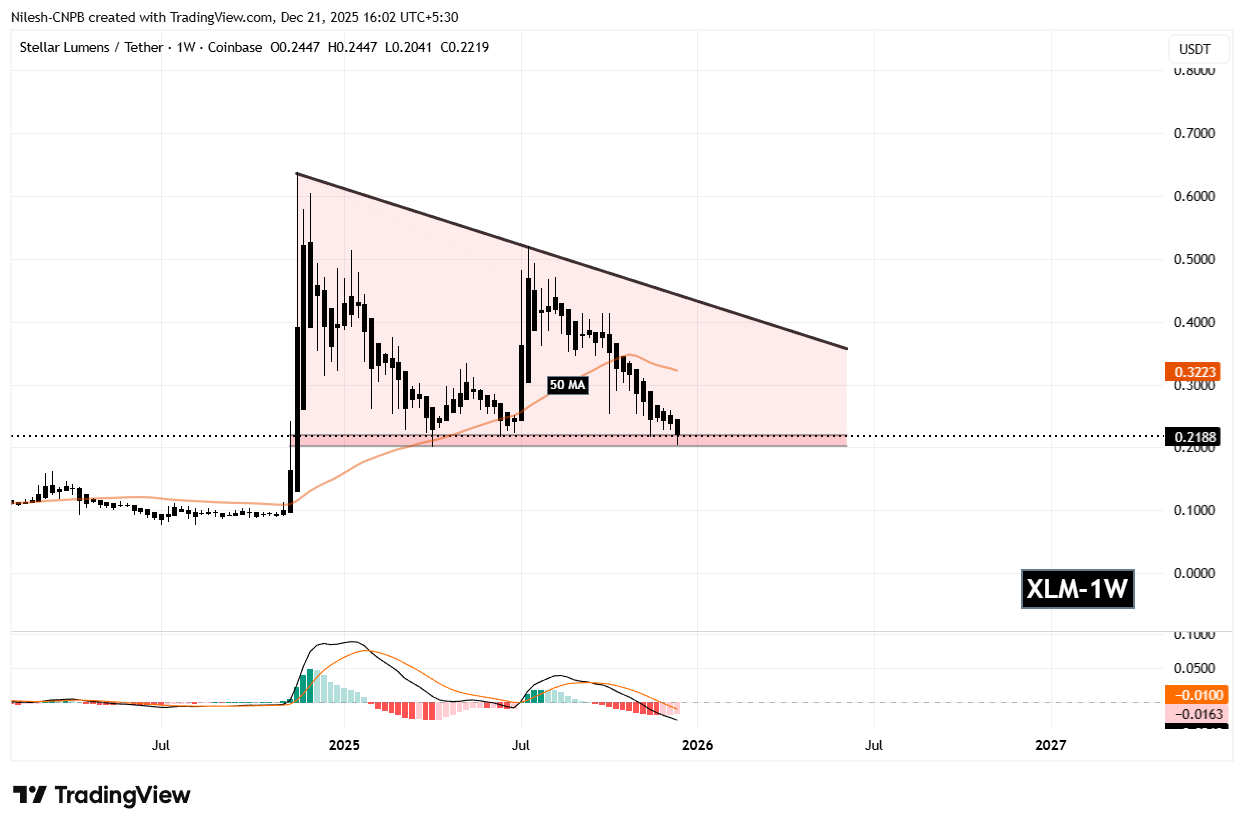
Stellar (XLM) Daily Chart/Coinsprobe (Source: Tradingview)
At the same time, XLM is trading below its 50-week moving average, currently near the $0.32 region. This moving average has historically marked important shifts in trend direction, and price behavior around it often determines whether rallies can gain traction or fade quickly.
What’s Next for XLM?
As long as the $0.20–$0.22 support zone remains intact, the probability of a rebound stays firmly on the table. A sustained defense of this level could allow XLM to stabilize and attempt a move back toward the descending trendline resistance near $0.32. This area aligns closely with the 50-week moving average, making it a key zone that bulls would need to reclaim to signal improving market structure.
A decisive weekly close above the descending trendline would be a notable technical development. Such a move would invalidate the bearish bias of the triangle and could open the door for a broader trend reversal, especially if accompanied by rising volume and improving momentum across the wider crypto market.
That said, the downside risk remains clearly defined. A weekly close below the $0.20 support would confirm a breakdown from the triangle and could expose XLM to deeper declines, with the next major support area sitting closer to the $0.13 region.
For now, Stellar sits at a pivotal inflection point. With price pressing against long-term support and sellers struggling to force a breakdown, the coming weeks are likely to be decisive in determining whether XLM can stage a meaningful rebound or extend its broader corrective trend.
Disclaimer: The views and analysis presented in this article are for informational purposes only and reflect the author’s perspective, not financial advice. Technical patterns and indicators discussed are subject to market volatility and may or may not yield the anticipated results. Investors are advised to exercise caution, conduct independent research, and make decisions aligned with their individual risk tolerance.
Disclaimer: The information on this page may come from third parties and does not represent the views or opinions of Gate. The content displayed on this page is for reference only and does not constitute any financial, investment, or legal advice. Gate does not guarantee the accuracy or completeness of the information and shall not be liable for any losses arising from the use of this information. Virtual asset investments carry high risks and are subject to significant price volatility. You may lose all of your invested principal. Please fully understand the relevant risks and make prudent decisions based on your own financial situation and risk tolerance. For details, please refer to
Disclaimer.
Related Articles
SHIB Holder Count Hits 1.5 Million Amid Crucial Price Breakout Prospects
SHIB holder count hits 1.5 million, showing steady long-term accumulation.
Exchange supply drops, with fewer tokens available for trading.
Price remains in downtrend, waiting for a strong breakout above recent highs.
Shiba Inu — SHIB, is drawing attention as the memecoin surpasses 1.5 mi
CryptoNewsLand13m ago
Bitcoin ETF ends with seven straight red days, and renewed downward pressure hits the Bitcoin price
Recently, after experiencing a net inflow for seven consecutive trading days, the U.S. Bitcoin spot ETF saw a significant outflow, with a net outflow of $163.5 million on the 18th and another outflow of $51.9 million on the 19th, indicating a simultaneous weakening of market capital and prices. Bitcoin's price briefly fell below $70,000, highlighting that the fund flows of the ETF can no longer support its rebound, and the deteriorating macro environment is putting pressure on risk assets, causing a noticeable contraction in investor preference. The testing of the $70,000 threshold has become a barometer for short-term market sentiment.
区块客1h ago
On the 28th day of the US-Iran war, JPMorgan stated that Bitcoin has passed the qualification exam for "digital gold."
JPMorgan's report points out that during the ongoing war in Iran, Bitcoin has shown demand similar to that of safe-haven assets, with stable capital flows, in contrast to the trend of gold, which is historically experiencing consecutive declines. This demonstrates Bitcoin's resilience in geopolitical crises, prompting a market reassessment. JPMorgan's analysts believe that Bitcoin has exhibited its potential as digital gold, but uncertainty remains for the future.
動區BlockTempo1h ago
The Futarchy of Privacy: Umbra's Fit in a Private Crypto World
The essay discusses the need for "Verifiable Privacy" in professional trading, highlighting Umbra's unique technical approach and performance-based tokenomics. It notes the privacy sector’s strong growth and upcoming catalysts for Umbra’s expansion.
CoinDesk1h ago
Gold plummets, "safe haven for funds" changes hands? JPMorgan: During the war, "Bitcoin becomes the new darling of hedging."
JPMorgan pointed out that in the Middle East conflict, Bitcoin has shown strong resilience against declines, with significant inflows and active trading, while gold and silver are facing capital outflows. Under pressure from high interest rates and a strong dollar, gold prices have fallen by about 15%. With its borderless characteristics, Bitcoin has become a safe-haven choice, and institutional investors are also adjusting their positions, indicating a decrease in gold liquidity while Bitcoin liquidity is increasing.
区块客1h ago
