Cardano (ADA) enters the early days of the new year with a positive outlook, continuing to maintain a stable upward momentum and trading around the $0.36 mark at the time of writing on Friday. On-chain indicators along with developments in the derivatives market show a clear improvement, reflecting increasing buying pressure and growing investor interest. In this context, technical signals continue to lean towards a positive scenario, with a focus on the potential formation of a breakout trend in the near future.
On-chain and Derivatives Data of Cardano Indicate an Uptrend
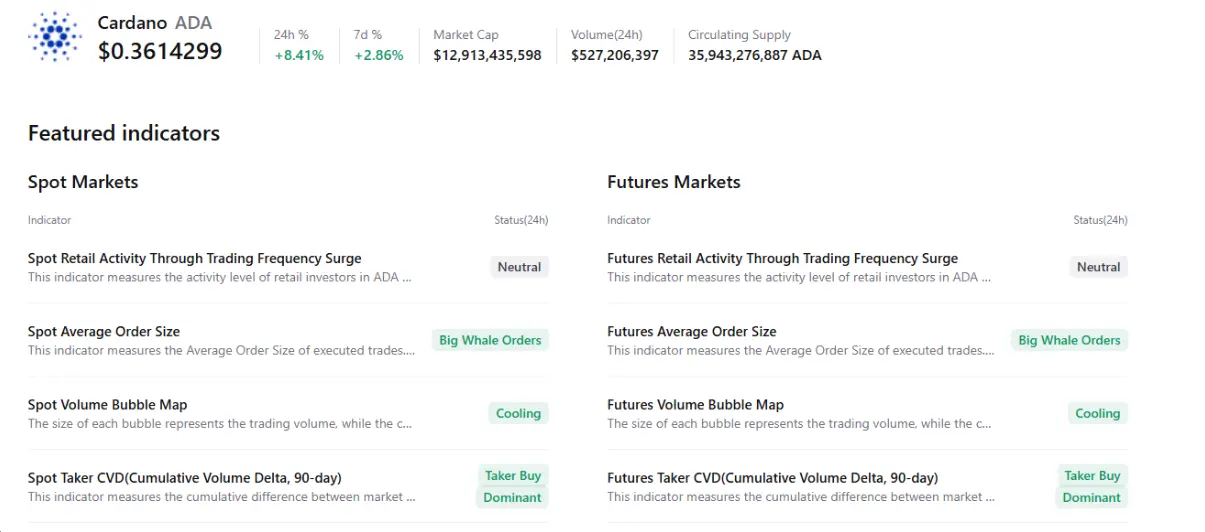
Aggregated data from CryptoQuant paints an optimistic picture for Cardano. Both the spot market and futures contracts show large buy orders from “whales,” amid cooling market conditions and a clear dominance of buying pressure. These signals suggest trader sentiment is significantly improving, raising expectations for a potential bullish breakout in the coming days.
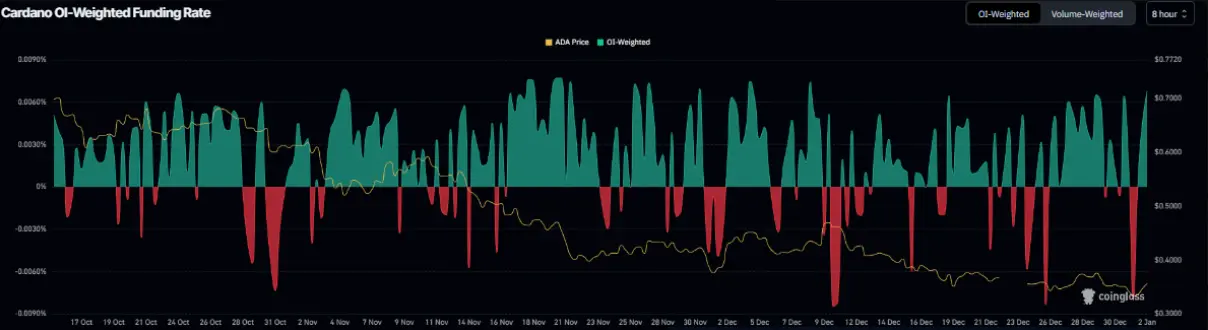
 Source: CryptoQuant Not only that, but Cardano’s funding rate data also reinforce the positive outlook. According to the OI-Weighted Funding Rate index from Coinglass, the number of traders betting on an upward trend currently outweighs those expecting continued weakness in price.
Notably, the funding rate has turned positive since Thursday and reached 0.0068% on Friday, reflecting that the (Long) side is willing to pay fees to the (Short) side. Historically, as shown on the chart, whenever the funding rate shifts from negative to positive, Cardano’s price has often experienced strong upward movements.
 Cardano Funding Rate Chart | Source: Coinglass## Cardano Price Forecast: New Year Brings Optimism as ADA Approaches Breakout of Descending Wedge Pattern
The price of Cardano (ADA) faced strong resistance at the upper trendline of the descending wedge pattern — formed from mid-October by connecting the peaks and troughs with two converging trendlines. After being rejected at this level on Monday, ADA plunged nearly 10% by Wednesday. However, the market quickly saw a significant rebound: the price recovered 6.9% on Thursday and by Friday had approached the critical resistance trendline again.
In a positive scenario, if ADA decisively breaks out of the descending wedge pattern, the recovery momentum is likely to extend toward the nearest resistance zone around $0.42 — coinciding with the 50-day exponential moving average (EMA), which holds notable technical significance.
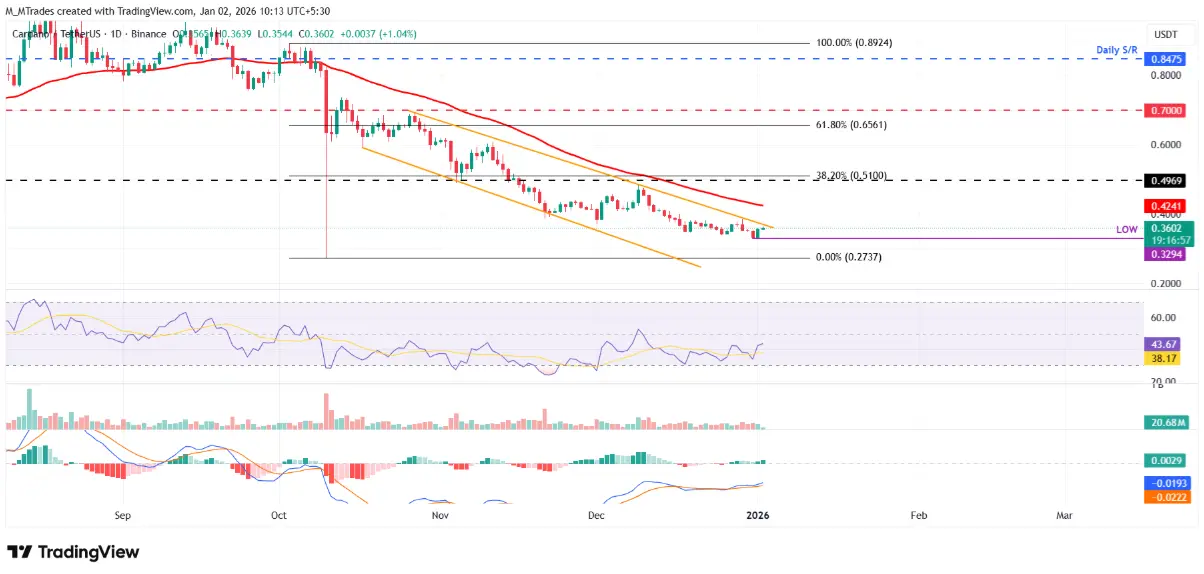 Daily ADA/USDT Chart | Source: TradingView Momentum indicators are also signaling improvement. The RSI on the daily timeframe is currently at 43 and trending upward toward the neutral zone at 50, indicating selling pressure is gradually weakening. For the bullish trend to become more sustainable, RSI needs to break above and hold above 50. Meanwhile, the MACD indicator has formed a bullish crossover and remains maintained, further supporting the view that the market is leaning slightly towards a recovery scenario.
However, the risk of correction still exists. If ADA fails to break out and reverses downward, the price could continue to test the support zone established on Wednesday, around the $0.32 level.
Disclaimer: The information on this page may come from third parties and does not represent the views or opinions of Gate. The content displayed on this page is for reference only and does not constitute any financial, investment, or legal advice. Gate does not guarantee the accuracy or completeness of the information and shall not be liable for any losses arising from the use of this information. Virtual asset investments carry high risks and are subject to significant price volatility. You may lose all of your invested principal. Please fully understand the relevant risks and make prudent decisions based on your own financial situation and risk tolerance. For details, please refer to
Disclaimer.
Related Articles
XRP Supply Shift: Whales Add 200 Million Tokens as Price Eyes $1.50 - U.Today
XRP has seen a significant increase in whale activity, with 200 million XRP bought recently, while network activity and wallet numbers reach new highs. A "golden cross" signals potential price rises, as the SEC clarifies crypto asset regulations.
UToday1h ago
Bitcoin Breaks Below $71,000, Ethereum Falls Below $2,200! Nearly $300 Million in Liquidations Across the Network in 4 Hours, Inflation, Conflict, and Political Deadlock "Triple Kill" Crypto Market
The crypto market experienced a sharp decline on the evening of the 18th, with Bitcoin falling below $71,000 and Ethereum dropping to $2,200. The causes include U.S. PPI data exceeding expectations, which reduced the likelihood of Federal Reserve rate cuts; escalating Middle East conflicts increasing geopolitical risks; and gridlock in the U.S. Congress over crypto regulations. Market sentiment was severely damaged, with 110,000 people liquidated in just 4 hours, resulting in losses of $300 million.
動區BlockTempo3h ago
Here’s Where Gold Price Could Go After the FOMC Decision
Gold is in a bearish trend, forming a waterfall pattern with lower highs and lows. Watch the 4905 level; a break could lead to a drop toward 4841. Upcoming FOMC announcements may cause volatility, impacting price movements.
CaptainAltcoin3h ago
A Certain CEX Survey: 74% of Institutions Expect Cryptocurrency Market to Rebound in the Next 12 Months, Allocation Willingness Continues to Strengthen
Despite the crypto market's pullback since last year, the latest survey shows that institutional investor confidence remains solid, with 73% planning to increase digital asset allocation by 2026, and 74% expecting market recovery over the next 12 months. Most institutions prefer to invest through regulated instruments while focusing on regulatory clarity and risk management.
GateNews4h ago
Shiba Inu (SHIB) Shows Warning Signs as Price Hints at Another Dip
Shiba Inu price has returned to a delicate zone after several failed attempts to push higher. Recent price action shows SHIB struggling to break above a descending resistance line. That pattern has started raising concerns about another short-term decline.
Market observers began paying
CaptainAltcoin4h ago
