
Date: Wed, Dec 31, 2025 | 03:40 PM GMT
As the final hours of 2025 approach, the broader cryptocurrency market is showing modest strength. Both Bitcoin (BTC) and Ethereum (ETH) are trading slightly in the green, helping ease recent volatility and stabilize overall market sentiment. This calmer environment has allowed select altcoins — including Plasma (XPL) — to begin forming constructive technical setups after extended periods of downside pressure.
XPL is starting to attract attention with an impressive 11% daily jump, trimming its 60-day decline to roughly 43%. While the broader trend still reflects recovery mode, the more important signal is emerging on the daily chart, where price action is beginning to suggest a meaningful structural shift. If confirmed, this setup could mark the early stages of a bullish continuation heading into the new year.
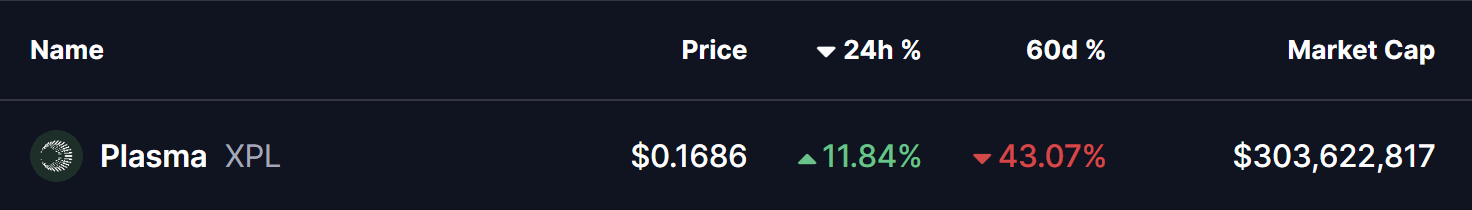
Source: Coinmarketcap
Rounding Bottom in Play
On the daily timeframe, XPL appears to be forming a textbook rounding bottom pattern — a classic bullish reversal structure that typically develops after a prolonged downtrend. This pattern reflects a slow but steady transition from selling dominance to accumulation, as bearish momentum fades and buyers gradually regain control.
Earlier in the trend, XPL faced strong rejection near the $0.3321 neckline zone, triggering a sharp decline that extended through November and December. That sell-off ultimately found a floor near the $0.1152 level, which has since proven to be a critical demand zone. Repeated defenses of this area prevented further downside and laid the foundation for a potential trend reversal.
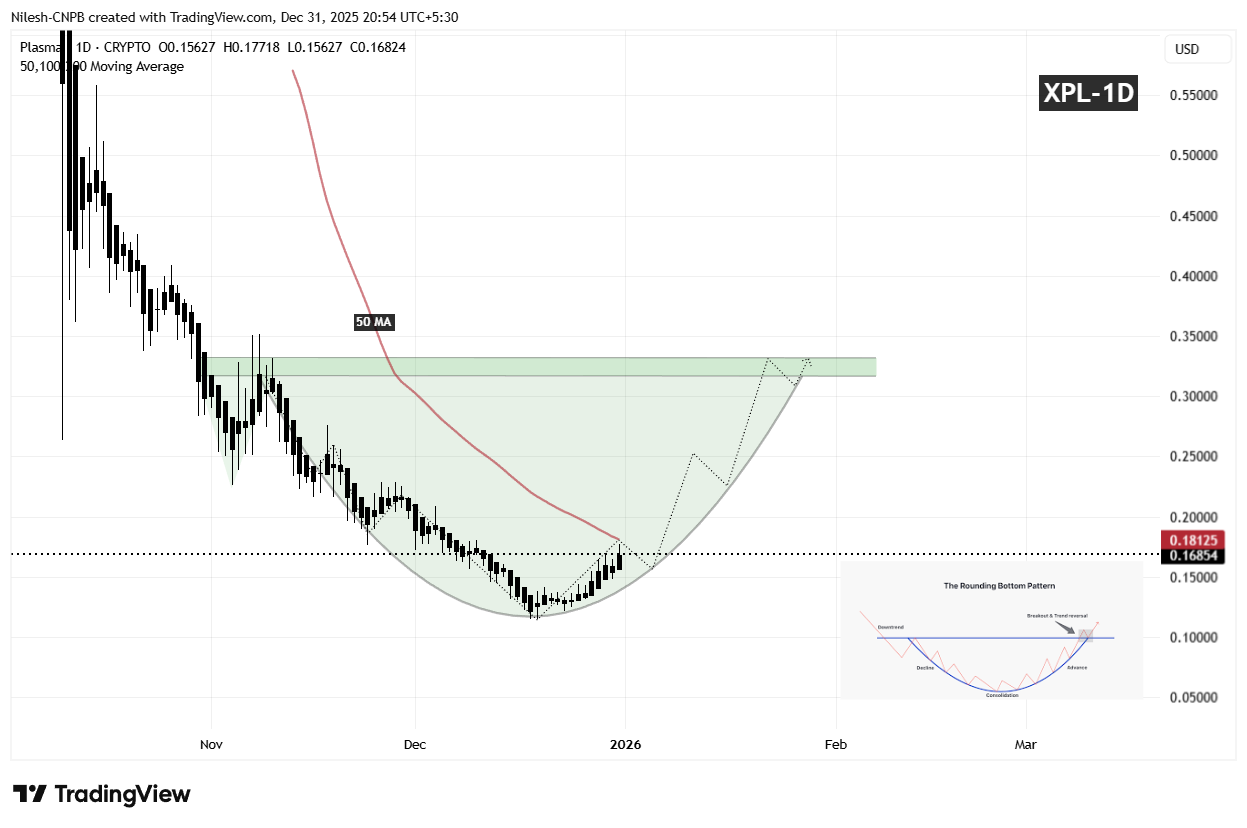
XPL Daily Chart/Coinsprobe (Source: Tradingview)
Since establishing that base, XPL has begun to curve higher in a rounded fashion, mirroring the classic structure of a developing bottom. This gradual recovery suggests that selling pressure is no longer aggressive, and that accumulation is taking place beneath the surface. The recent push back above the $0.16 region further reinforces the idea that buyers are positioning ahead of a larger directional move.
What’s Next for XPL?
For the rounding bottom pattern to gain confirmation, XPL needs to reclaim the 50-day moving average, currently positioned near the $0.1812 level. A sustained move above this area would signal a clear momentum shift and indicate that bulls are regaining control after months of corrective price action.
Looking higher, the most significant technical barrier remains the neckline resistance around $0.3321, highlighted by the prior distribution zone on the chart. A clean breakout above this region would validate the entire reversal structure and could open the door for a broader bullish expansion phase, with momentum traders and sidelined participants likely re-entering the market.
Until those levels are reclaimed, the pattern remains in its development phase. Short-term consolidation or minor pullbacks remain possible if price struggles near the 50-day moving average. However, as long as XPL continues to hold higher lows above the $0.1152 base, the broader bottoming structure remains intact.
Overall, XPL is approaching a technically important inflection point. The emerging rounding bottom formation, improving price structure, and proximity to key resistance levels suggest the coming sessions could prove decisive for Plasma’s next major directional move as the market transitions into 2026.
Disclaimer: The views and analysis presented in this article are for informational purposes only and reflect the author’s perspective, not financial advice. Technical patterns and indicators discussed are subject to market volatility and may or may not yield the anticipated results. Investors are advised to exercise caution, conduct independent research, and make decisions aligned with their individual risk tolerance.
About Author: Nilesh Hembade is the Founder and Lead Author of Coinsprobe, with over 5 years of experience in the cryptocurrency and blockchain industry. Since launching Coinsprobe in 2023, he has been providing daily, research-driven insights through in-depth market analysis, on-chain data, and technical research.
Disclaimer: The information on this page may come from third parties and does not represent the views or opinions of Gate. The content displayed on this page is for reference only and does not constitute any financial, investment, or legal advice. Gate does not guarantee the accuracy or completeness of the information and shall not be liable for any losses arising from the use of this information. Virtual asset investments carry high risks and are subject to significant price volatility. You may lose all of your invested principal. Please fully understand the relevant risks and make prudent decisions based on your own financial situation and risk tolerance. For details, please refer to
Disclaimer.
Related Articles
Michael Saylor: Strategy - There is a time lag between buying Bitcoin and price appreciation
Gate News reports that on March 12, Strategy founder Michael Saylor posted: "There is a time lag between when we purchase Bitcoin and when the Bitcoin price skyrockets."
GateNews1m ago
Why OXT Just Skyrocketed 21.97% in 30 Minutes
OXT price surged 21.97%, now at $0.0211, driven by macroeconomic trends and increased trading activity. Analysts suggest the bullish sentiment in major cryptocurrencies boosts altcoin interest, while traders watch key resistance and support levels.
Coinfomania5m ago
BTC Rises 0.79% in 15 Minutes: On-Chain Large Capital Inflows and Favorable Macro Policies Drive Market Upswing
2026-03-12 15:15 to 2026-03-12 15:30 (UTC), BTC recorded a +k-line return of 0.79%, with price fluctuating between 69702.5 and 70428.9 USDT, reaching an amplitude of 1.04%. Trading activity was robust during this time window, with noticeably elevated market attention and intensified short-term volatility.
The primary driver of this price movement was on-chain large fund flows and increased institutional participation. During the same period, multiple large transfers exceeding 1,000 BTC flowed into exchange cold wallets, with whale addresses concentrating their buying activities. [Text appears to be incomplete]
GateNews9m ago
ETH 15-minute surge 0.94%: On-chain capital inflows and technical upgrade expectations resonate to drive gains
2026-03-12 15:15 to 2026-03-12 15:30 (UTC), ETH fluctuated within 1.15%, with price rising from 2047.22 USDT to 2070.72 USDT, achieving +0.94% gains. During the same period, market attention increased, trading volume expanded significantly, volatility enhanced compared to daily levels, and on-chain activity and capital flow data expanded synchronously, indicating concentrated efforts from bullish forces.
The main driving forces behind this price movement stem from concentrated on-chain capital inflows and technical upgrade expectations resonance. On-chain data shows that during the anomaly period ETH activity
GateNews9m ago
Bitcoin-to-Gold Ratio Shows Bullish Divergence, Bitcoin ETF Net Inflows of $906 Million Over the Past Month
On March 12, Bitcoin's ratio against gold displayed bullish divergence, indicating weakened selling pressure and potentially serving as a reference point for Bitcoin's long-term trend bottom. Bitcoin ETF net inflows reached approximately $906 million, while gold ETF experienced single-day outflows of $3 billion, forming a notable divergence. Despite ETF trading volume being lower than US equities, there remains significant room for institutional capital entry. Historically, Bitcoin has often rebounded following geopolitical turmoil.
GateNews10m ago
REQ Soars 21.77% — What Does This Mean for Traders?
Request Network (REQ) surged 21.77% within an hour, reaching $0.0839 amid growing trader interest. Market conditions, bullish sentiment, and DeFi trends may be driving this rally, while traders monitor key resistance and support levels for future movements.
Coinfomania49m ago