**Date: **Sat, Jan 03, 2026 | 04:25 PM GMT
As 2026 kicks off, the broader cryptocurrency market is showing renewed stability. Ethereum (ETH) has reclaimed the $3,100 level, and momentum is gradually rotating into select altcoins — including World Liberty Financial (WLFI).
WLFI has jumped nearly 9% on the day, extending its weekly gains to around 16%, but the more important development is unfolding on the chart. On lower timeframes, price action is forming a well-defined bullish structure, suggesting that the token may be gearing up for a meaningful breakout if key levels are reclaimed.
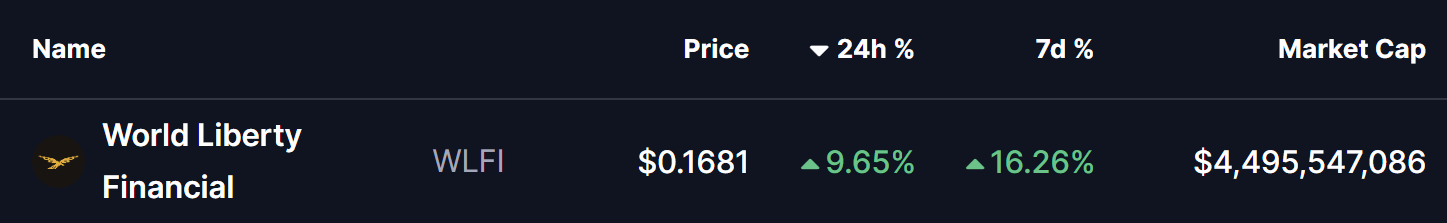
Source: Coinmarketcap
Ascending Triangle In Play
On the 4-hour chart, WLFI is forming a clear ascending triangle, characterized by a series of higher lows pushing steadily into a flat resistance zone. This pattern is widely viewed as a bullish continuation setup, especially when it develops during a prolonged consolidation phase accompanied by consistent dip-buying.
WLFI recently faced rejection near the $0.1741 resistance zone, which capped multiple upside attempts. That rejection pushed price back toward the rising support trendline, with buyers stepping in around the $0.1222 region. Importantly, each pullback has been shallower than the last, reinforcing the presence of strong underlying demand.
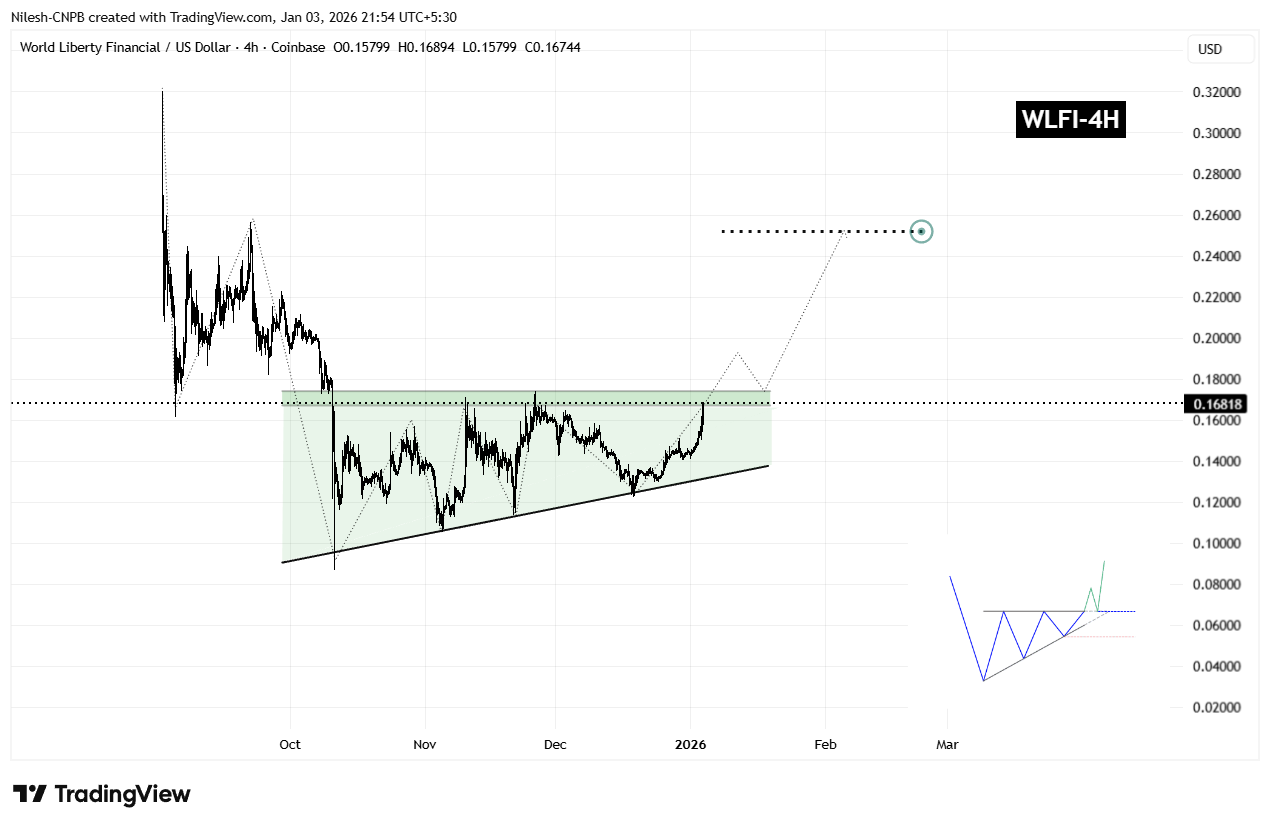
WLFI 4H Chart/Coinsprobe (Source: Tradingview)
The latest rebound has once again carried WLFI toward the upper boundary of the triangle, reinforcing the idea that demand remains firm. Rather than signaling weakness, this sideways-to-higher price action reflects healthy consolidation as volatility tightens ahead of a potential breakout.
What’s Next for WLFI?
From here, WLFI appears poised for another test of the $0.1741 resistance. A decisive breakout above this level, followed by a sustained close and a successful retest as support, would confirm the ascending triangle pattern and likely trigger a broader bullish expansion phase.
Based on the measured move of the formation, the technical upside projection points toward the $0.2522 region. This target represents a potential upside of roughly 48% from current levels and also aligns with prior price structure, strengthening the bullish case.
That said, caution remains warranted. If WLFI fails to break above resistance, price could once again rotate back toward the rising support trendline. As long as this trendline continues to hold, the broader bullish structure remains intact. A decisive breakdown below ascending support, however, would invalidate the pattern and delay any breakout scenario.
For now, the combination of improving market sentiment, steady accumulation, and a tightening ascending triangle suggests that WLFI is approaching a critical inflection point — one that could define its next major move as the new year unfolds.
Disclaimer: The views and analysis presented in this article are for informational purposes only and reflect the author’s perspective, not financial advice. Technical patterns and indicators discussed are subject to market volatility and may or may not yield the anticipated results. Investors are advised to exercise caution, conduct independent research, and make decisions aligned with their individual risk tolerance.
About Author: Nilesh Hembade is the Founder and Lead Author of Coinsprobe, with over 5 years of experience in the cryptocurrency and blockchain industry. Since launching Coinsprobe in 2023, he has been providing daily, research-driven insights through in-depth market analysis, on-chain data, and technical research.
Disclaimer: The information on this page may come from third parties and does not represent the views or opinions of Gate. The content displayed on this page is for reference only and does not constitute any financial, investment, or legal advice. Gate does not guarantee the accuracy or completeness of the information and shall not be liable for any losses arising from the use of this information. Virtual asset investments carry high risks and are subject to significant price volatility. You may lose all of your invested principal. Please fully understand the relevant risks and make prudent decisions based on your own financial situation and risk tolerance. For details, please refer to
Disclaimer.
Related Articles
BTC 15-minute rally of 0.85%: Fed policy shift and ETF capital resonance drive buying momentum
From 2026-03-12 09:30 to 2026-03-12 09:45 (UTC), Bitcoin (BTC) experienced a rapid surge within a 0.93% volatility range, achieving a return of +0.85%, with prices fluctuating between 69678.0 and 70324.2 USDT. Trading volume increased approximately 38% compared to the previous hourly average. Market attention surged significantly, with short-term bullish sentiment amplified notably.
The primary driver of this market movement was the Federal Reserve Chair's early morning release of policy shift signals, hinting that the pace of future rate hikes may slow down. The market broadly interpreted this as a marginal improvement in the liquidity environment
GateNews1h ago
PI Token Maintains Bullish Trend as Anticipation for Pi Day Grows
PI token trades above $0.21 after rallying over 25% in the past 7 days as anticipation for the upcoming Pi Day on March 14 grows.
PiScan recorded 3 million PI deposits to exchanges in 24 hours, suggesting near-term profit taking which could reverse the bullish trend.
Pi Network’s PI token tr
CryptoNewsFlash1h ago
Why Didn't BTC Drop During Geopolitical Conflicts? Answers From Binance's Fund Structure and CVD
The article analyzes the relationship between Binance's BTC balance changes and market demand, indicating that the decrease in BTC balances in the short term is related to genuine demand, especially during the US-Iran conflict. The widening gap in spot trading volume suggests active buying activity, supporting the presence of real demand. Although short-term demand may stabilize BTC prices, the long-term trend still leans downward, and the process of demand recovery could be lengthy.
PANews1h ago
Glassnode Data: Most XRP Supply in Loss, What It Means for Investors
Glassnode data shows 36.8 billion XRP, nearly 60% of the circulating supply, is held at a loss, with unrealized losses reaching $50.8 billion.
XRP traded near $1.34, while futures volume jumped on BitMEX and Binance as ETF outflows and weak spot activity kept pressure on price.
Glassnode dat
CryptoNewsFlash1h ago
23.38% Surge for OGN: What It Means for Investors
OGN's price surged 23.38% in 15 minutes, currently at $0.03356, driven by robust trading volume and market activity. Analysts cite macroeconomic factors and regulatory news influencing investor sentiment, while traders monitor key resistance and support levels.
Coinfomania1h ago
Bitcoin Supply Shock Imminent? Whale Holdings in Dormancy, Retail Selling Intensifies Price Volatility
The Bitcoin market is undergoing structural changes, with short-term holders selling off due to financial pressures, while long-term investors remain dormant, indicating potential supply shocks. Currently, Bitcoin is priced at $69,446, and although some holdings are at a loss, the stability of long-term holders could support the market. Analysts advise paying attention to on-chain indicators and whale activity to evaluate future price trends and liquidity risks.
GateNews1h ago