
Key Takeaways
-
SKY is forming a rounding bottom pattern on the daily chart
-
Price has rebounded strongly from the $0.0419 demand zone
-
Rising volume supports improving bullish momentum
-
A breakout above $0.0778 could confirm trend reversal
-
Pattern projection points toward the $0.11 region
Sky (SKY), the native governance and utility token of the Sky Protocol (formerly MakerDAO), has stepped into the spotlight after posting a strong daily move of over 8%, accompanied by a sharp 35% surge in trading volume. While the short-term momentum is drawing attention, the more compelling story is unfolding on the higher timeframe chart.
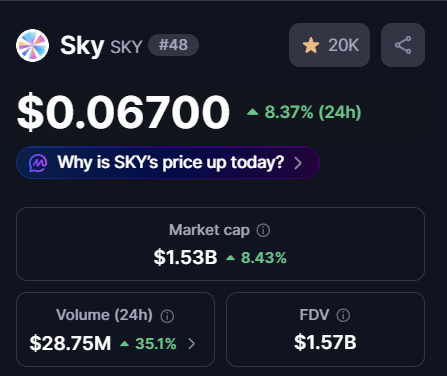
Source: Coinmarketcap
Price action is now forming a classic bullish reversal structure — one that often signals the transition from prolonged weakness into a new recovery phase.
Rounding Bottom Pattern Signals Trend Shift
On the daily timeframe, SKY appears to be completing a rounding bottom formation, a well-known bullish reversal pattern that typically develops after extended downtrends. This structure reflects a gradual shift in market psychology, where persistent selling pressure slowly fades and long-term accumulation begins to dominate.
Earlier in the trend, SKY faced repeated rejection near the $0.0778 neckline resistance, which triggered a steep sell-off. That decline ultimately bottomed near $0.0419, marking a critical demand zone where buyers aggressively stepped in and prevented further downside.
Since establishing this low, price action has steadily curved higher, forming a smooth rounded base. This gradual recovery — rather than a sharp V-shaped bounce — suggests healthier accumulation rather than short-term speculation.
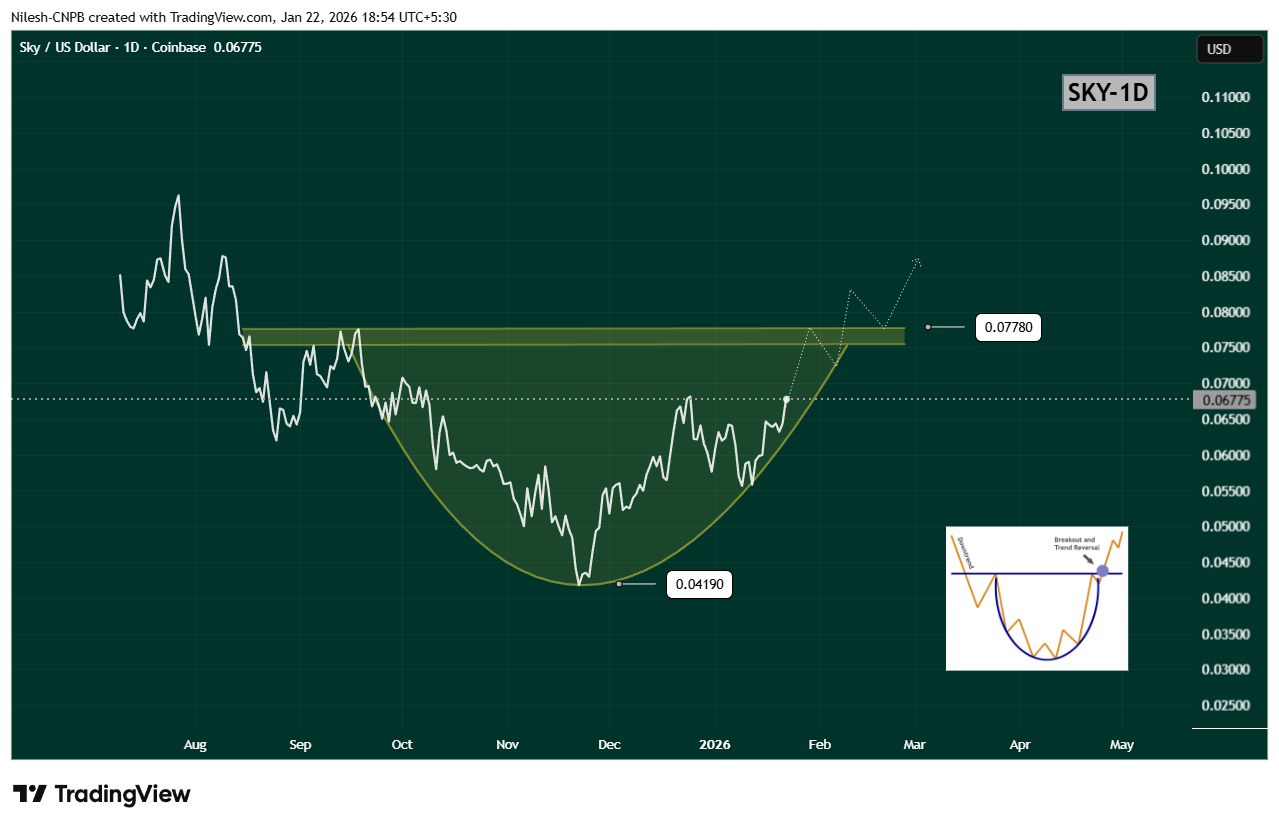
$SKY Daily Chart/Coinsprobe (Source: Tradingview)
Breakout Zone Comes Into Focus
Recent price action shows SKY reclaiming the $0.06933 region, a level that previously acted as resistance. This move strengthens the bullish structure and signals that buyers are gaining confidence ahead of a potential neckline test.
The key level to watch now is the $0.0778 resistance zone. A decisive daily close above this level would confirm the rounding bottom breakout and mark a clear shift in trend structure. Ideally, a breakout followed by a successful retest of this zone as support would further validate the bullish case.
Upside Projection and Risk Outlook
Based on the depth of the rounding bottom, the measured upside projection points toward the $0.11 region. Reaching this target would represent a potential 60–65% upside from current levels, aligning well with historical behavior of similar reversal patterns.
That said, patience remains important. Before any confirmed breakout, SKY could still experience short-term pullbacks or consolidation near the rising curve of the pattern. Such moves would not invalidate the bullish setup, as long as price continues to hold above recent higher lows.
A breakdown below the rounding base would weaken the structure, but for now, momentum favors the bulls.
Bottom Line
SKY is showing clear signs of a trend reversal in progress, with a rounding bottom pattern taking shape on the daily chart. Rising volume, improving structure, and a steady recovery toward neckline resistance all suggest that accumulation is underway.
If SKY can break and hold above $0.0778, the path opens toward the $0.11 region, signaling a broader bullish continuation. Until then, consolidation and minor pullbacks remain possible — but the overall structure is one that traders will be watching closely.
Disclaimer: The views and analysis presented in this article are for informational purposes only and reflect the author’s perspective, not financial advice. Technical patterns and indicators discussed are subject to market volatility and may or may not yield the anticipated results. Investors are advised to exercise caution, conduct independent research, and make decisions aligned with their individual risk tolerance.
About Author: Nilesh Hembade is the Founder and Lead Author of Coinsprobe, with over 5 years of experience in the cryptocurrency and blockchain industry. Since launching Coinsprobe in 2023, he has been providing daily, research-driven insights through in-depth market analysis, on-chain data, and technical research.
Disclaimer: The information on this page may come from third parties and does not represent the views or opinions of Gate. The content displayed on this page is for reference only and does not constitute any financial, investment, or legal advice. Gate does not guarantee the accuracy or completeness of the information and shall not be liable for any losses arising from the use of this information. Virtual asset investments carry high risks and are subject to significant price volatility. You may lose all of your invested principal. Please fully understand the relevant risks and make prudent decisions based on your own financial situation and risk tolerance. For details, please refer to
Disclaimer.
Related Articles
Uptrend Encountering Resistance? Analysis: Bitcoin Rebound May Face Headwinds Between $75,000 and $85,000
Bitcoin is currently around $74,611, facing resistance near the $75,000 level, with $85,000 being a larger resistance zone. Despite bullish signals appearing in the derivatives market and a short-term uptick in risk appetite, the increase in Bitcoin flowing into exchanges may bring profit-taking pressure. Market focus is concentrated on the Federal Reserve's interest rate decision, and if the results fall short of expectations, it will affect the sustainability of Bitcoin's rebound.
区块客45m ago
Chainlink Dominates Discussion in RWA Sector
The RWA (Real World Asset) tokenization sector is drawing significant attention, highlighted by Chainlink's dominance with 14.2 million interactions, far surpassing other projects. The article examines market perceptions and potential for growth among top projects like ONDO and AVAX.
TapChiBitcoin1h ago
Fear and Greed Index Returns Above 40, BTC Weekly Gains 5.66%, ETH Weekly Gains 13%
Data from Xinfire Research Institute shows that from March 11-18, the Nasdaq index declined 1.26%, Bitcoin rose 5.66%, and Ethereum gained 13%. The Fear and Greed Index has exited the extreme fear zone. The Federal Reserve will release statements related to rate cuts tomorrow.
GateNews2h ago
Bitcoin Pulls Back to $73,500, Ethereum Consolidates at $2,300, CryptoQuant: Uptrend Faces Double Resistance, Fed Decision Thursday Becomes Key
Bitcoin reached a high of 75,500 USD today before pulling back to 73,910 USD. CryptoQuant points out that there is double resistance in the 75,000 to 85,000 USD range. The market is awaiting the Federal Reserve's interest rate decision announcement and Powell's assessment of stagflation. If the results are hawkish, it will increase resistance at the 75,000 USD level. Overall market sentiment remains consolidating sideways.
動區BlockTempo3h ago
CryptoQuant Alert: Bitcoin Bounce May Face Resistance Between 75,000 and 85,000 USD
CryptoQuant report shows bullish signals in the Bitcoin futures market, but if the price continues to rise, it will encounter resistance near $75,000 and $85,000. Meanwhile, the inflow of Bitcoin into centralized exchanges is accelerating, which may signal potential selling pressure, creating a contradiction with the bullish sentiment in the futures market.
MarketWhisper3h ago
