
Key Takeaways
-
Hyperliquid’s HIP-3 markets recorded a new all-time high daily volume of $4.83B
-
Open interest surged to a record $1.05B, up sharply from $260M last month
-
$HYPE has outperformed the broader crypto market, rising while ETH fell 24% YTD
-
The daily chart shows a Bearish Shark harmonic pattern, allowing short-term upside
-
A move toward $38.72 remains possible if momentum holds above the 50-day MA
HYPE, the native token of **Hyperliquid **— one of the fastest-growing decentralized perpetual trading platforms — has continued to show relative strength despite a broader crypto market downturn. While major assets like Ethereum (ETH) have suffered a sharp 24% decline year-to-date, HYPE has managed to stay bullish, posting over 21% gains during the same period.
This divergence has naturally caught traders’ attention. But beyond short-term price action, a deeper look into on-chain growth metrics and technical structure suggests that HYPE’s momentum may be driven by strong underlying fundamentals rather than pure speculation.
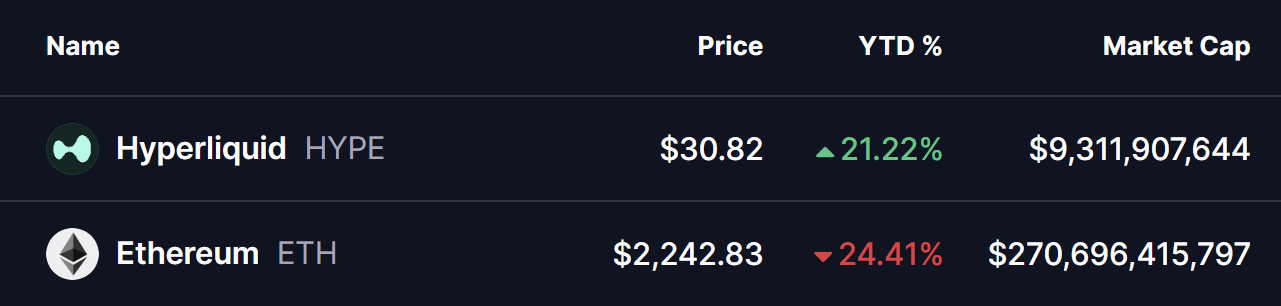
Source: Coinmarketcap
Hyperliquid’s HIP-3 Markets Hit Record Activity
According to the latest data from Flowscan, Hyperliquid’s HIP-3 protocol — launched last fall to enable permissionless on-chain markets for assets like gold, silver, and other commodities — has entered a phase of explosive growth.
Over the past week, daily trading volume across HIP-3 markets surged to approximately $4.83 billion, marking a new all-time high. At the same time, open interest (OI) climbed to a record $1.05 billion, fueled largely by rising demand for on-chain commodities exposure.
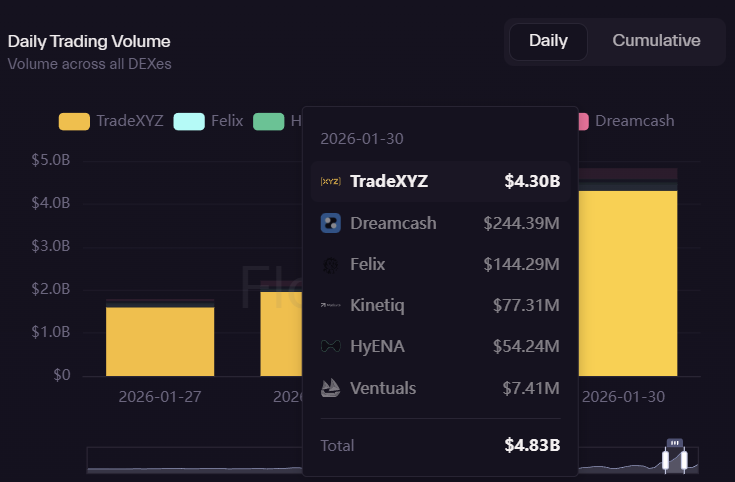
Source: Flowscan
What makes this growth particularly notable is its speed. Just a month ago, HIP-3 open interest hovered near $260 million. Since then, OI has consistently printed new weekly highs, signaling a rapid influx of capital and increasing trader participation within the Hyperliquid ecosystem.
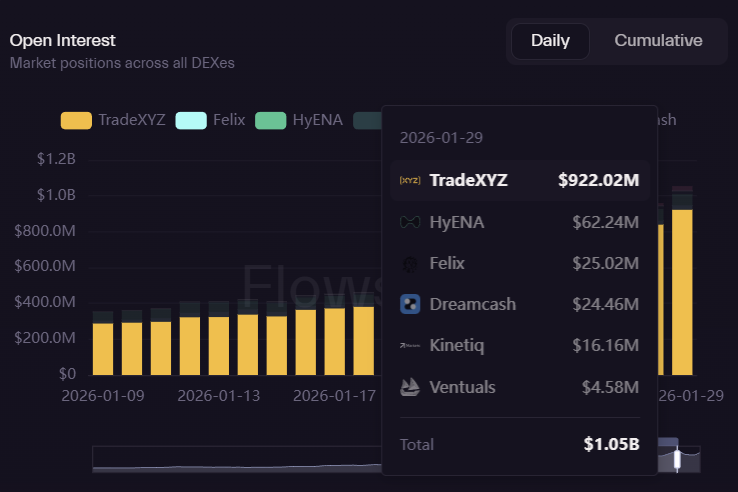
Source: Flowscan
This surge in volume and open interest reflects growing confidence in Hyperliquid’s infrastructure and execution — a dynamic that historically acts as a strong tailwind for the platform’s native token.
$HYPE Technical Structure Signals Room for Upside
From a technical standpoint, HYPE’s daily chart is forming a Bearish Shark harmonic pattern. While the name sounds ominous, this structure often appears during corrective phases and can still allow for short-term bullish continuation before a larger trend decision unfolds.
After completing the O–X–A–B leg, HYPE successfully reclaimed its 50-day moving average, a key signal that short-term momentum has shifted back in favor of buyers. Since then, price has been consolidating near the $30 region, suggesting accumulation rather than distribution.
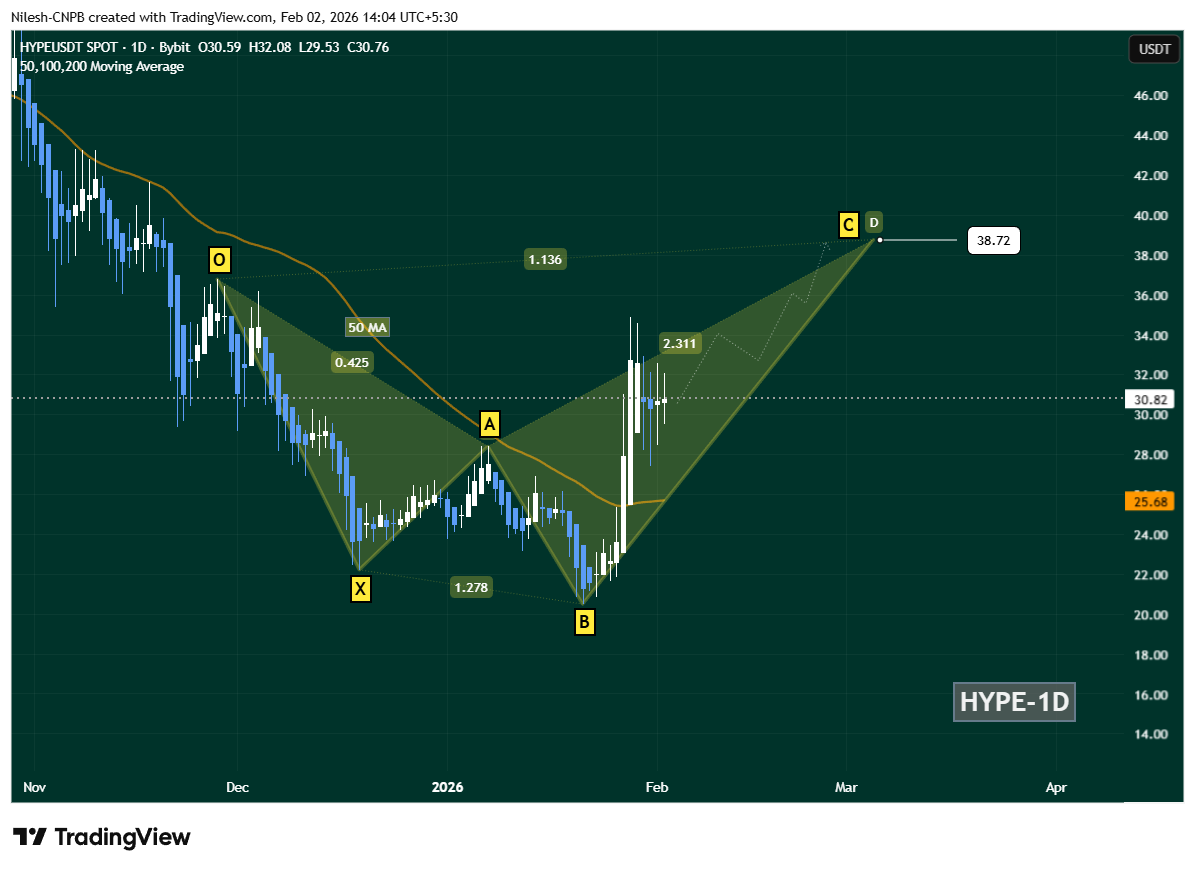
Hyperliquid (HYPE) Daily Chart/Coinsprobe (Source: Tradingview)
If current momentum holds, HYPE could continue its advance toward the C-point of the Shark pattern near $38.72. This level aligns closely with the 1.13 Fibonacci extension, a common target zone during harmonic pattern development and a logical area for the next technical reaction.
Market Outlook
With HIP-3 markets printing record volumes and open interest expanding at a rapid pace, Hyperliquid’s ecosystem growth appears firmly intact. If on-chain activity continues to scale alongside favorable technical conditions, HYPE may remain one of the stronger relative performers in the current market environment.
For now, traders will be watching whether HYPE can maintain support above the 50-day moving average and build enough momentum to challenge the $38–$40 resistance zone in the coming sessions.
Disclaimer: The views and analysis presented in this article are for informational purposes only and reflect the author’s perspective, not financial advice. Technical patterns and indicators discussed are subject to market volatility and may or may not yield the anticipated results. Investors are advised to exercise caution, conduct independent research, and make decisions aligned with their individual risk tolerance.
About Author: Nilesh Hembade is the Founder and Lead Author of Coinsprobe, with over 5 years of experience in the cryptocurrency and blockchain industry. Since launching Coinsprobe in 2023, he has been providing daily, research-driven insights through in-depth market analysis, on-chain data, and technical research.
Disclaimer: The information on this page may come from third parties and does not represent the views or opinions of Gate. The content displayed on this page is for reference only and does not constitute any financial, investment, or legal advice. Gate does not guarantee the accuracy or completeness of the information and shall not be liable for any losses arising from the use of this information. Virtual asset investments carry high risks and are subject to significant price volatility. You may lose all of your invested principal. Please fully understand the relevant risks and make prudent decisions based on your own financial situation and risk tolerance. For details, please refer to
Disclaimer.
Related Articles
Analyst: If Bitcoin falls below the $66,000 support level, it may trigger a 10%-20% correction
Gate News reported that on March 20, Chartered Market Technician (CMT) Aksel Kibar stated on March 21 that the lower support boundary of Bitcoin's potential rising wedge formation is located at 66,000, and a breakdown below this level could trigger a bearish reversal. Aksel Kibar pointed out that rising wedges, as a classic technical pattern, typically appear at the end of uptrends, signaling price momentum exhaustion. Historical data shows that after similar downside breakdowns are confirmed, the average pullback ranges from 10%-20%.
GateNews6m ago
Bitcoin Slips Below $70,000 as Fed Rate Pause and Oil Surge Pressure Markets
Bitcoin declined to $70,000 due to steady interest rates from the Federal Reserve and rising energy prices, leading to $600 million in liquidations and increased market volatility, particularly affecting altcoins.
CryptoBreaking51m ago
XRP Climbs 3% Past $1.47 as Breakout Extends on Bitcoin-Led Rally
Key Takeaways
XRP broke above $1.426 resistance after months of consolidation, jumping to $1.47 on surging volume
Trading volume spiked over 250% during the move, indicating strong participation in the breakout
Activity on the XRP Ledger continues climbing, with tokenized real-world assets
CryptoBreaking56m ago
BTC down 0.65% in 15 minutes: Large spot selling orders dominate short-term pullback, panic sentiment intensifies volatility amplification
2026-03-20 13:45 to 2026-03-20 14:00 (UTC), BTC declined 0.65% within 15 minutes, with price range fluctuating between 69795.3 to 70399.4 USDT, reaching an amplitude of 0.86%. Market volatility intensified in the short term, trading activity increased, and investor attention rose.
The main driver of this price movement was concentrated large-scale active selling in the spot market. During this period, major trading platforms saw multiple large sell orders exceeding 100 BTC each, with sell orders accounting for 52% of volume, directly driving prices downward.
GateNews2h ago
