
HYPE has been stuck in a choppy stretch after failing to hold its push above the mid-$30s.The price has bounced back several times around the low-$32s, each time the price makes an attempt to move higher, another rejection occurs around the $35 mark.
This has made the market quite fragile as everyone is leaning long based on support levels, but the risk of falling down is building quietly. This volatility squeeze could lead to a sudden move if the support levels begin to fail.
Liquidity Pressure Is Building Under the HYPE Price
Ardi’s heatmap is basically showing a classic liquidation setup forming right underneath the HYPE price. Even though price action looks fairly calm on the surface, there’s a lot going on below.
The chart shows a huge liquidity zone stacked between $28 and $32, which is exactly where a lot of leveraged longs would get forced out if things start slipping. Right now, the HYPE price is hovering in the low-$30s, but the deeper story is that the market is building a massive pool of exposure underneath.
One of the clearest levels on the chart is $32.5. The HYPE price keeps bouncing off it, and buyers keep stepping in like it’s solid support. But there’s a catch, every time the price tries to push higher, it keeps getting rejected near $35.
That repeated failure creates a trap. Traders keep going long expecting the same bounce again, and that only adds more liquidation pressure below. The longer the HYPE price stays stuck under resistance, the bigger that downside pool becomes.
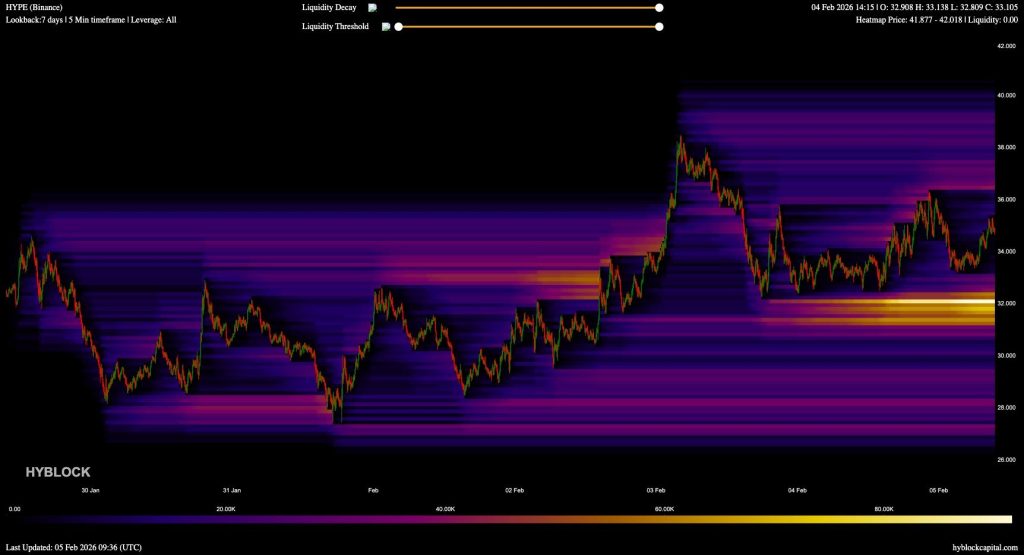
Source: X/@ArdiNSC
The brightest area on the heatmap sits directly under current price, and that’s the big warning sign. Ardi calls it a “wall of long liquidations,” and it’s easy to see why. There’s a thick concentration of levels where longs would get wiped out fast if support breaks.
If the HYPE price loses $32.5 cleanly, the chart shows a pretty open runway down toward $28. Moves like that don’t usually happen slowly, liquidation cascades can send price dropping in a hurry.
Ripple’s Hyperliquid Move Could Change How Wall Street Trades Crypto_**
Why Market Makers Love These Setups
Ardi’s message is simple: if support cracks, market makers feast. That happens because liquidity zones act like magnets. When too many traders pile into longs in the same area, price often gets pushed down to clear them out before any real bounce can happen.
The HYPE price is still holding for now, but the pressure underneath keeps building. A breakout above resistance would flip the whole setup, but as long as $35 keeps rejecting, that liquidation risk stays very real.
At this point, the chart makes one thing clear: the HYPE price isn’t breaking yet, but the liquidity below is getting heavier every day.
Disclaimer: The information on this page may come from third parties and does not represent the views or opinions of Gate. The content displayed on this page is for reference only and does not constitute any financial, investment, or legal advice. Gate does not guarantee the accuracy or completeness of the information and shall not be liable for any losses arising from the use of this information. Virtual asset investments carry high risks and are subject to significant price volatility. You may lose all of your invested principal. Please fully understand the relevant risks and make prudent decisions based on your own financial situation and risk tolerance. For details, please refer to
Disclaimer.
Related Articles
Citigroup Slashes Bitcoin and Ethereum 12-Month Price Targets, Citing Stalled U.S. Crypto Legislation Weighing on Upside Catalysts
Citigroup has lowered its 12-month price targets for Bitcoin and Ethereum, signaling a shift toward caution on the cryptocurrency market's medium-term outlook, primarily due to slow progress in U.S. crypto asset legislation. Bitcoin's target was reduced from $143,000 to $112,000, while Ethereum's fell to $3,175. Despite upside potential remaining in the future, the lack of new policy catalysts suggests prices may oscillate within a range in the near term. Citigroup's assessment of Ethereum is more cautious, as it believes the asset is more significantly impacted by on-chain activity.
区块客28m ago
Bitcoin Holds Strong at $70,000! On-Chain Data Reveals "Collective Selling Wave," Retail Investors Emerge as Biggest Selling Pressure
Under Middle East geopolitical tensions, Bitcoin faced widespread selling pressure, particularly from retail holders. According to Glassnode data, the market is experiencing heavy selling pressure, with the accumulated trend score declining to 0.04, indicating that retail and small-to-medium investors are reducing their positions significantly. Despite this, Bitcoin's resilience against the decline has surprised market observers.
区块客53m ago
ENJ Rockets Past $0.027 — 23% Surge Signals Momentum
Enjin Coin has surged 22.96% in 30 minutes, reaching $0.02737, reflecting increased trading activity and market interest. With a 24-hour change of +43.30%, traders are monitoring support at $0.025 and resistance at $0.030, suggesting potential trends ahead.
Coinfomania56m ago
Ethereum Returns to $2,300: Whales Accumulate 540,000 ETH, Exchange Inflows Drop to 10-Month Low
Ethereum's price rebounded above $2,300 on March 18, primarily driven by whale purchases and net exchange outflows. On-chain data shows investors have reduced their selling pressure, with supply tightening. Technical indicators reveal short-term resistance at $2,380 to $2,400, with support near $2,320. The futures market is also displaying positive signals.
GateNews1h ago
XRP Ledger Activity Surges as Price Holds Near Key Resistance
Key Insights
XRP Ledger processed over 2.5 million transactions in 24 hours, reflecting rising network engagement while the asset price remained stable near resistance.
XRP price holds near $1.41 while forming higher lows, indicating buyers continue supporting the asset despite repeated resis
CryptoFrontNews1h ago
