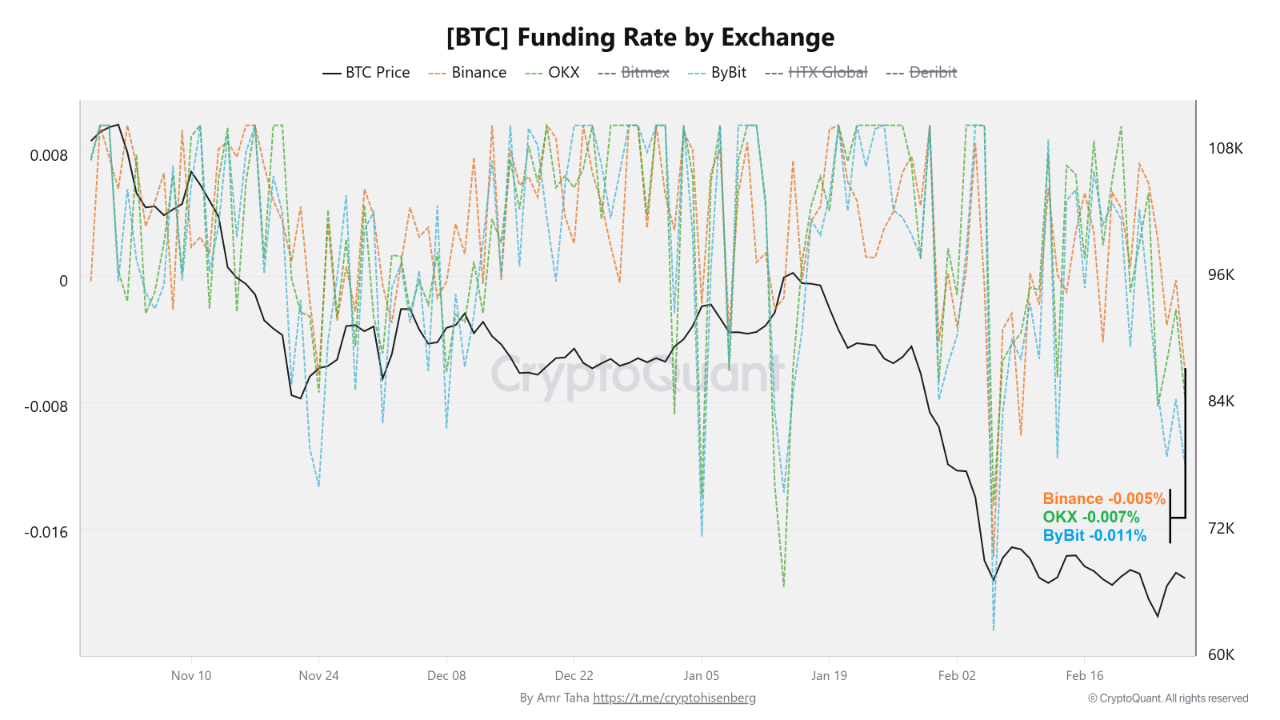
The funding rates for Bitcoin perpetual futures on major cryptocurrency derivatives exchanges have fallen to -0.005%, -0.007%, and -0.011%, reflecting that bears currently dominate the derivatives market. Analysts point out that historically, extreme short interest ratios often precede sharp reversals, but whether macroeconomic conditions align remains a key variable.
Funding Rate Mechanism and Current Market Implications
In perpetual futures contracts, the funding rate is the periodic fee exchanged between longs and shorts to keep the contract price aligned with the spot market. When the funding rate is negative, it means shorts pay longs, typically indicating a strongly bearish overall market sentiment.
Analyst Amr Taha referenced Bitcoin liquidation data in a market update on February 27: there are large leveraged positions above the current price, with many short entries around $92,000. He noted that if Bitcoin breaks upward, these short positions will face forced liquidations, creating a short squeeze and amplifying price volatility.
Taha said, “If macroeconomic conditions improve, the likelihood of prices rising again in the short and medium term increases.” However, he emphasized that relying solely on the funding rate is insufficient for predicting market direction. Historically, large short interest combined with negative funding often signals a sharp reversal, but it requires additional indicators for comprehensive analysis.
Retail Return and Whale Movements: Contradictory Market Signals
CryptoQuant contributor Nino observed that retail traders are trading at significantly higher frequencies than the one-year average, indicating that individual funds are cautiously flowing back into the market, seen as a potential sign of improved sentiment.
However, whale activity suggests different signals. Taha tracked about 1,700 Bitcoin flowing from the “Octopus” wallet group (representing medium-term holders) into Binance. Notably, the same group had transferred 5,000 Bitcoin into Binance on February 2, 2025, after which Bitcoin declined from above $77,500. The current inflow is much smaller; Taha assessed, “This lower intensity suggests that selling pressure may not be as strong as before.”
Bitcoin tested the $70,000 level on February 26 but failed to hold it. At the time of writing, it was trading around $68,000, down 0.4% in 24 hours, and has been consolidating for seven days. Glassnode analysts pointed out that despite short-term stability, Bitcoin has yet to show real bottoming signals.
Key Bitcoin Market Data Snapshot
(Source: CryptoQuant)
Funding Rate: Negative across major exchanges, ranging from -0.005% to -0.011%
7-Day Trend: Sideways consolidation around $68,000 (0.4% decline in 24 hours)
30-Day Performance: Down approximately 24%
From All-Time High (October 2025): About 46% decline
Around $92,000: Liquidation map shows dense short positions; a breakout could trigger a short squeeze
Frequently Asked Questions
What does a negative Bitcoin funding rate mean, and what is its significance for retail investors?
A negative funding rate indicates a high proportion of shorts in the derivatives market, with shorts paying longs to maintain their positions. For retail investors, this metric reflects a generally bearish sentiment in the derivatives market, but it does not directly determine the spot market trend. It is usually used in conjunction with liquidation maps, open interest, and other indicators to analyze overall market structure.
What is a “short squeeze,” and how does a negative funding rate increase its likelihood?
A short squeeze occurs when a large concentration of short positions faces upward price movement, forcing traders to cover their shorts at higher prices, which further drives up the price in a chain reaction. Extremely negative funding rates suggest a large short interest, and combined with dense short positions shown on liquidation maps near $92,000, any upward catalyst could lead to significant forced liquidations, accelerating and amplifying upward price moves.
With Bitcoin down 46% from its all-time high, can we say the bottom is in?
A decline alone cannot confirm a bottom. Confirming a bottom typically requires multiple technical and on-chain indicators. Glassnode analysts noted that despite recent short-term stability, there are no definitive signs of a true bottom recovery. Investors should evaluate a combination of data points such as funding rates, ETF capital flows, retail activity, and other metrics rather than relying on a single indicator.
Disclaimer: The information on this page may come from third parties and does not represent the views or opinions of Gate. The content displayed on this page is for reference only and does not constitute any financial, investment, or legal advice. Gate does not guarantee the accuracy or completeness of the information and shall not be liable for any losses arising from the use of this information. Virtual asset investments carry high risks and are subject to significant price volatility. You may lose all of your invested principal. Please fully understand the relevant risks and make prudent decisions based on your own financial situation and risk tolerance. For details, please refer to
Disclaimer.
Related Articles
Bitcoin Shows Value Bottom Signals but True Market Floor Missing
Bitcoin is at a "Value Bottom" ideal for long-term dollar-cost averaging, but has not yet reached a "Structural Bottom," leading to projected volatility between $60K-$70K. Investors should prepare for continued fluctuations and potential buying opportunities.
BlockChainReporter1h ago
Bitcoin Trades Narrow Range As Resistance Holds Near $71K
Bitcoin is trading around $70,335, showing a 2.13% decline in 24 hours. Analysts note a resistance near $71,400 and a consolidation phase, with traders awaiting a decisive breakout above or below established support and resistance levels.
CryptoBreaking1h ago
BTC 15-minute rise of 0.60%: ETF capital inflows and technical breakout resonance drive short-term momentum
2026-03-13 12:45 to 2026-03-13 13:00 (UTC), BTC achieved a +0.60% return within 15 minutes, with a price range of 72341.6-72888.0 USDT and a volatility amplitude of 0.76%. Short-term price oscillations noticeably intensified. Due to abundant trading volume, market attention rose rapidly, reflecting a phase of strengthened buying power.
The primary drivers of this movement are continuous net inflows into ETFs and a technical breakout of key structures. In March 2026, BTC spot ETFs attracted capital inflows as high as 1.6 billion dollars in a single week.
GateNews2h ago
DeFi enters a "winter of yields": liquidity stagnation, leverage contraction, and the disappearance of arbitrage opportunities
The DeFi market entered an "interest rate winter" since September 2025, with deposit rates for major stablecoins declining sharply and supply-demand imbalances causing liquidity congestion. The rate decline reflects reduced capital demand and a lack of high-return opportunities. Stablecoin lending demand has dropped significantly, with market risk appetite shifting toward more stable investment channels. In response to this situation, the Sky protocol demonstrates competitiveness and adaptability by introducing real-world assets to enhance yields. The low interest rates during this phase can be viewed as an opportunity for DeFi market transformation.
区块客2h ago
"Seeking a Sword by Marking a Boat" - Style Coin Price Predictions Go Viral: The Practical Logic and Flaws of Mystical Prophecies
Author: Frank, PANews
Whenever the market enters a confusing phase of going nowhere, people try to use a "cutting the boat to seek the sword" method of historical retrospection to predict the next market movement. In such cases, people often see from these theories and charts that history always repeats itself, and seem to automatically overlay and verify future price movements with a certain period in the past.
This coincidence seems to have a magical effect and is often verified. Some bloggers claim this prediction method has an accuracy rate of 75%~80%.
Does this "cutting the boat to seek the sword" style price prediction that repeatedly goes viral on social media help the market identify stages, or is it just packaging noise as prophecy?
From "Tick Fractals" to "History Rhyming"
The peak operation regarding predictions of October 2025 market tops is an analyst named CryptoBullet, who created a method called "ti
区块客2h ago